Maybe, but not yet…
EVER SINCE the mid-term election results were tallied and the dimensions of the Federal Reserve’s second round of Quantitative Easing were laid out, Gold Prices have gyrated wildly, says Brad Zigler at Hard Assets Investor.
A precipitous plunge, followed by a screaming ascent to new nominal highs, left traders reeling. The moves in the Gold Price prompted analysts to wonder anew if the gold market was staging another run-up, or was in fact stumbling about in the terminal stages of a decade-long bull run. Talk of a bubble burst in Gold Prices also resurfaced.
The bubble question’s been debated for some time now. Analysts often compare bullion’s run to the dot-com mania of the 1990s, and, as we’ll see, there are some startling similarities. The endgame for the tech stock bubble featured extremes in the magnitude and the velocity of stock price changes. In early 2000, prices ran up fast and, just as quickly, collapsed.
In the wake of the recent QE2 announcement, the Gold Price certainly spiked sharply higher, but bullion’s path hasn’t yet traced the pattern that usually precedes a blow-off top. Emphasis on the word “yet”.
Look back at gold’s bull run, starting in 2001, and compare it with that of the Nasdaq Composite in the 1990s…
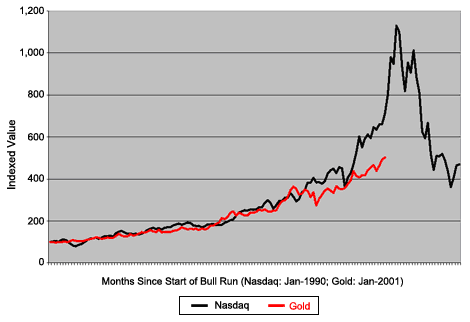
Presently, gold’s bull market is 118 months old and, based on the London morning fix at October’s end, has bestowed a 501% gain on bullion holders.
Some 118 months into its run-up, meantime, the technology-laden Nasdaq Composite had appreciated 713%. At that point, the Nasdaq was just four months shy of its ultimate top – a gain of 1,130% from its January 1990 base. And those last four months were some of the Nasdaq’s most volatile. The index exhibited an annualized volatility of 19.3% over the preceding decade, but its standard deviation ballooned to 34.5% in the terminal trimester of its bull run.
Gold’s volatility over the past decade has remained a relatively quiescent 17.0% per annum, less than that of the contemporaneous equity market. The new highs scored by gold, too, aren’t running far ahead of bullion’s average price. When a market reaches toward a frothy apex, prices will typically advance faster than average, but the recent highs in the Gold Price have fallen well within the metal’s normal volatility pattern.
Over the past decade, Gold Prices have notched new highs when bullion has traded 17% above its 10-month moving average. New highs in September and October were just 12% and 15%, respectively, above the metal’s average price.
So history suggests that gold will need an even steeper price climb to form a proper bubble – the final inflation before the inevitable pop. And November’s trading action to date certainly seems to be setting the stage for such drama. Spot gold spiked 3.1% higher in the first third of the month, as volatility rose to 23.2%.
That Gold Prices will eventually fall is a pretty much a given. The question is when, and from what level.
Let’s deal with the “level” part first. A large contingent of gold aficionados believes that gold will converge upon its inflation-adjusted high set back in January 1980. A London fix of $850 projected through 30 years of a rising Consumer Price Index would make that target at $2,253 presently.
Now, go back to the Nasdaq model. The rise in the last four months of the index’s 2000 run-up was a whopping 58%. Bullion would need to notch a 69% gain to hit its inflation-adjusted high by the 122nd month of its bull run.
Doable? One can’t say it isn’t. How probable, though?
Well, to significantly dull gold’s luster, the fundamentals that set gold on its present course – namely the debasement of the US Dollar, together with the uncertainty and fear precipitated by global terrorism –must be mitigated. Bullion’s run isn’t being fueled by a dearth of metal, but rather out of a lack of faith in the greenback. That faith isn’t likely to be restored in four months’ time.
The evidence of gold’s utility as the “anti-dollar” is scribed by its price trail in the world’s other reserve currency, the Euro. Since the common currency launched in 1999, gold’s price has climbed at a compound annual rate of 14.6% in Dollars. Gold’s appreciation in Euro terms has been just 12.9% per annum since 1999. The new highs bullion is now lodging in dollars just aren’t being matched by new Euro records. Gold’s scored a new high in the Eurozone currency back in June and hasn’t yet exceeded it.
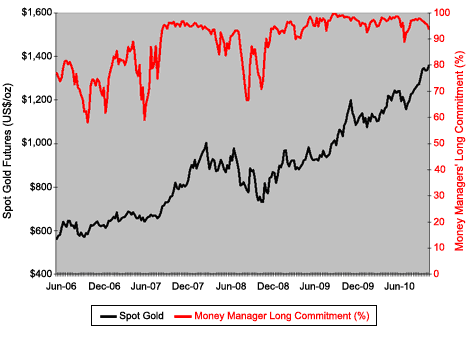
Now let’s consider the “when” part. There will likely be early warning signs of a shift in gold market dynamics before a blow-off occurs. The so-called “smart money” – the hedge funds and institutional accounts that have been driving investment demand for bullion – may ditch gold, out of fear of diminishing returns or simply to exploit better opportunities in other markets. When the hedgies leave, the gold market will be left to smaller speculators.
In fact, we’ve seen a bit of that already. The net speculative length of the Comex gold futures market fell in October, after weeks of unabated expansion. Long positions held by all speculators – large together with small – dipped by 9% in time for Halloween. Parsing the trader commitment data reveals the outflow was actually an exodus of money managers from the gold market. The number of funds holding long positions in gold futures fell 9%, while the fund runners lightened their net long contract commitments by 12%.
But while institutions and hedge funds exited the market, small speculators increased their long gold exposure. There was a 5% uptick in the size of small speculators’ net long position in October. So the influx of small speculators filling a vacuum left by large traders typically speaks of a late-stage bull market. It’s the “little guy” that gets in last. We ought to see even more dramatic evidence of retail Johnny-come-latelys in the marketplace near the ultimate top of the gold market.
That’s not to say funds have lost all their interest in gold, though. Of the extant positions held by money managers, 94% are still long.
At one point earlier this year, virtually all gold positions held by funds were purchases, but now other opportunities beckon to fund capital. This exodus of capital also showed up in the SPDR Gold Shares Trust – the world’s largest Gold ETF – where we’ve seen a dissonance between prices and recent capital flows into the trust.
As Gold Prices climbed in early October, GLD’s Money Flow Index dropped precipitously – a harbinger of the price break that came at midmonth.
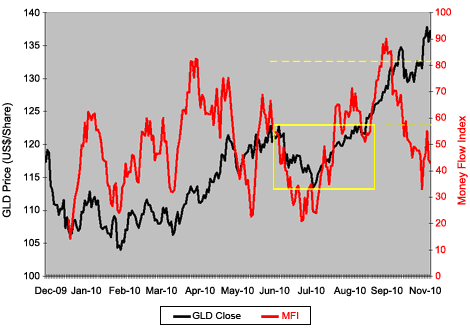
The Money Flow Index is a volume-weighted measure of the capital flows into and out of a security, and indicates the strength or weakness of a current price trend. When the MFI moves in the same direction as prices, it confirms trends and indicates they’re likely to continue. Divergence signals a likely change in the price trend.
In the week following Oct. 15, Gold Prices slumped nearly 4%. While prices have since recovered, the SPDR Gold trust’s MFI still remains relatively weak. We’ll see more divergence in GLD’s Money Flow Index when gold’s ready to top out.
So what next? Taking into account the forgoing, odds are there’s still some time left in gold’s run. And, as the Nasdaq bubble demonstrated, gold’s biggest gains are likely to be made in the immediate run-up to the market top.
This knowledge is likely to tempt more adventurous investors to jump aboard the gold train for the last leg of its bullish journey – however long that may run. The cautious among them will monitor early warning indicators for signs of topping.
There’s still money to be made from gold in the near term, I believe. Just how “near” is “near” is anybody’s guess, however.
Buying Gold today? Make it simple, secure and cost-effective by using the award-winning, mining-industry backed world No.1, BullionVault…
gol2664
No comments:
Post a Comment