Saturday, October 30, 2010

Randgold Resources announces Total Voting Rights

gol2664

Randgold Resources announces Total Voting Rights MarketWatch – Oct 29, 2010 JERSEY, CHANNEL ISLANDS, Oct 29, 2010 (MARKETWIRE via COMTEX) — RANDGOLD RESOURCES LIMITED Incorporated in Jersey, Channel Islands Reg. No. 62686 LSE Trading Symbol: RRS Nasdaq Trading Symbol … Randgold Resources Limited — Total Voting Rights – Marketwire


TODAY’S STOCK MARKET DOW JONES INDUSTRIAL AVERAGE DJI, NYSE, S&P 500, NASDAQ INDEX TRENDS, NOTES October 29th, 2010 Close

dow2664

The Commerce Department reported earlier today that the economy expanded at a 2% annual rate in the July through September quarter. Many were hoping for more as the rate of growth during the April through June period was also below average at 1.7% growth. Consumers held up their end of the bargain a bit better by helping increase spending growth values. These posted values show a 2.6% growth in spending, up from the 2.2% growth value posted in the second quarter. This represents a continuation of the slow economic recovery trends. Progress has been slow and recovery stimulation continues to be debated. Federal aid is needed to strengthen the economy as planning and method of intervention implementation becomes more controversial as we approach the mid term elections. It is anticipated that the Federal Reserve will launch a plan to purchase government bonds in an attempt to make loans cheaper and prompt lending, spending and economic growth. Overall today, uncertainty outweighed all else and stocks showed little movement as investors sidelined themselves ahead of next week’s Federal Reserve meeting. The Dow Jones Industrial Average finished in the green by .04% and finished at 11,118.49. The NYSE ended the day in the green as well and settled at 7,514. The Nasdaq finished in the green at 2,507.41. The S&P 500 fell into the red by .04% and settled at 1,183.26. The dollar gained on the euro by .0009 and the ten year treasury yield was 2.61%. Author: Frank Matto

TODAY'S STOCK MARKET DOW JONES INDUSTRIAL AVERAGE DJI, NYSE, S&P 500, NASDAQ INDEX TRENDS, NOTES October 29th, 2010 Close


Maxim Integrated Products (MXIM) Soars To New Highs

Maxim Integrated Products Inc. (NASDAQ:MXIM) shares rose 11.82% on Friday following the company's reporting of record revenue of $626.1 million beating the analysts' estimates of $604 million for the first quarter of fiscal year 2011 on Thursday. The shares of the company were trading at $21.91 after market closed and 14.66 million shares exchanged hands. Based on GAAP, diluted earnings per share in the September quarter was $0.39. The results were reduced by $17.9 million of special expense items which primarily consist of pre-tax expense for acquisition related items. GAAP earnings per share excluding special expense items was $0.43, while the analysts had expect3ed the Company to report an eps of $0.35. The Company reported net revenue of $626.1 million for its fiscal 2011 first quarter, an 11% increase over the $566.0 million revenue recorded in the prior quarter. Gross margin was 61.7% on GAAP basis and 63.4% on non-GAAP basis. MXIM provides a fiscal second quarter revenue outlook: $595 to $625 million and earnings per share: $0.36 to $0.41 GAAP ($0.39 to $0.44 excluding special expense items). Maxim Integrated Products is a publicly traded company that designs, manufactures, and sells high-performance semiconductor products. To date, it has developed over 6,400 products serving the industrial, communications, consumer, and computing markets.
tdp2664
Newsworthy Stocks


Why Buy Gold for Inflation Defense?

Wheat and cotton are rising in price. But they’re an impractical inflation hedge…

AS ALWAYS
seems the case, there is a big different between what the government statistics are reporting and what’s going on in the real world, writes Jake Weber, editor of The Casey Report.

According to the most recent inflation reading published by the Bureau of Labor Statistics (BLS), consumer prices grew at an annual rate of just 1.1% in August.

The government has an incentive to distort CPI numbers, for reasons such as keeping the cost-of-living adjustment for Social Security payments low. While there’s no question that you may be able to get a good deal on a new car or a flat-screen TV today, how often are you really buying these things? When you look at the real costs of everyday life, prices have risen sharply over the last year. For simplicity’s sake, consider the cash market prices on some basic commodities.

On average, our basic food costs have increased by an incredible 48% over the last year (measured by wheat, corn, oats, and canola prices). From the price at the pump to heating your stove, energy costs are up 23% on average (heating oil, gasoline, natural gas). A little protein at dinner is now 39% higher (beef and pork), and your morning cup of coffee with a little sugar has risen by 36% since last October.

You probably aren’t buying new linens or shopping for copper piping at the hardware store every day, but I included these items to show the inflationary pressures on some other basic materials that will likely affect consumer prices down the road.

The jump in gold and Silver Prices illustrates that it’s not just supply and demand issues driving the precious metals higher – the decline in purchasing power of the Dollar is also showing up in the price of physical goods. It is because stashing wheat and cotton in the garage is an impractical way to protect purchasing power that investors are increasingly looking to protect themselves with the monetary metals – a trend that is now very much in motion.

Buy Gold and physical Silver Bullion at the best prices possible by using the award-winning, mining-industry backed world No.1 online, BullionVault
gol2664


Dow Jones Indexes and UBS Announce 2011 Weights of Dow Jones-UBS Commodity Index

dow2664

Dow Jones Indexes and UBS Announce 2011 Weights of Dow Jones-UBS Commodity Index Benzinga – Oct 29, 2010 NEW YORK, Oct. 29, 2010 (GLOBE NEWSWIRE) — Dow Jones Indexes, a leading global index provider, and UBS Investment Bank announced the new target weightings for the Dow Jones-UBS Commodity Index SM …

Dow Jones Indexes and UBS Announce 2011 Weights of Dow Jones-UBS Commodity Index


Market News: Archer Daniels Midland (NYSE:ADM), Boeing Co. (NYSE:BA), Dupont (NYSE:DD)

Here are several more stock briefings which could affect stocks in trading later today. The following listed companies should see some movement: Archer Daniels Midland (NYSE:ADM), Boeing Co. (NYSE:BA), Dupont (NYSE:DD). Here is a more detailed look at the news that will affect each company when trading continues. Archer Daniels Midland (NYSE:ADM) Archer Daniels Midland (NYSE:ADM) is looking to consolidate and strengthen its executive lineup, with a number of changes. Ray Young will join as the Chief Financial Officer, who previously was working in General Motors Corporation. Steven Mills will be named as the senior executive vice president of performance and growth. John Rice, who led the company's commercial and production teams, will now handle the role of vice chairman and will be focusing on maximizing existing assets. Patricia Woertz, the CEO of Archer Daniels Midland (NYSE:ADM) said in a release that the announcements were part of the company’s initiative to grow shareholder value, earnings and the size of the company. Boeing Co. (NYSE:BA) Boeing (NYSE:BA) had some good news recently, with the finalization of a deal with Russian authorities on 737 airliners. The agreement also includes the purchase rights for an additional 35 Next -Generation 737s Marlin Dailey, vice president of Sales, Boeing (NYSE:BA) Commercial Airplanes said that "This is a great day in the history of our long and enduring partnership with Rostechnology. Today’s order for 737-700s, 737-800s and 737-900ERs underscores Rostechnology’s confidence in the world’s most successful single-aisle airplane. The entire Next-Generation 737 family offers superior operating economics and the 737-900ER has the best seat mile cost of any single-aisle airplane and provides our Next-Generation 737 customers with a compelling low-risk growth opportunity." Dupont (NYSE:DD) Two solar grades have been introduced by DuPont (NYSE:DD), in relation to its PET products. Both grades combine high stiffness with low warpage and have been specifically developed for long-term outdoor applications. DuPont (NYSE:DD) said that UV-resistant DuPont Rynite PET resins are designed for cost-effective manufacturing of photovoltaic module frames and components. According to DuPont (NYSE:DD), when used in photovoltaic applications, polymers can help increase design flexibility for assembly and installation. It can also provide an opportunity for functional integration. We could see more movement when trading continues for Archer Daniels Midland (NYSE:ADM), Boeing Co. (NYSE:BA) and Dupont (NYSE:DD).
tdp2664
E money daily


Why It Is So Hard to Start Your Own Business

dow2664

Why It Is So Hard to Start Your Own Business


Top 10 Industrial Stocks with Highest Return on Assets: CVVT, NFEC, RAVN, CWS, GGG, DNEX, FAST, OFLX, MMM, STRN (Oct 30, 2010)

Below are the top 10 Industrial stocks with highest Return on Assets ratio (ROA) for the last 12 months, UPDATED TODAY before 4:30 AM ET. ROA shows a company's efficiency in making profits from its assets. It is equal to net profits divided by total assets. Two Chinese companies (CVVT, CWS) are on the list.

China Valves Technology, Inc. (NASDAQ:CVVT) has the 1st highest Return on Assets in this segment of the market. Its ROA was 25.18% for the last 12 months. Its Asset Turnover ratio (revenue divided by assets) was 0.79 for the same period. NF Energy Saving Corp (NASDAQ:NFEC) has the 2nd highest Return on Assets in this segment of the market. Its ROA was 21.19% for the last 12 months. Its Asset Turnover ratio (revenue divided by assets) was 0.92 for the same period. Raven Industries, Inc. (NASDAQ:RAVN) has the 3rd highest Return on Assets in this segment of the market. Its ROA was 19.91% for the last 12 months. Its Asset Turnover ratio (revenue divided by assets) was 1.58 for the same period. China Wind Systems, Inc. (NASDAQ:CWS) has the 4th highest Return on Assets in this segment of the market. Its ROA was 19.79% for the last 12 months. Its Asset Turnover ratio (revenue divided by assets) was 1.32 for the same period. Graco Inc. (NYSE:GGG) has the 5th highest Return on Assets in this segment of the market. Its ROA was 18.17% for the last 12 months. Its Asset Turnover ratio (revenue divided by assets) was 1.35 for the same period.

Dionex Corporation (NASDAQ:DNEX) has the 6th highest Return on Assets in this segment of the market. Its ROA was 17.46% for the last 12 months. Its Asset Turnover ratio (revenue divided by assets) was 1.21 for the same period. Fastenal Company (NASDAQ:FAST) has the 7th highest Return on Assets in this segment of the market. Its ROA was 17.44% for the last 12 months. Its Asset Turnover ratio (revenue divided by assets) was 1.55 for the same period. Omega Flex, Inc. (NASDAQ:OFLX) has the 8th highest Return on Assets in this segment of the market. Its ROA was 15.45% for the last 12 months. Its Asset Turnover ratio (revenue divided by assets) was 1.41 for the same period. 3M Company (NYSE:MMM) has the 9th highest Return on Assets in this segment of the market. Its ROA was 14.46% for the last 12 months. Its Asset Turnover ratio (revenue divided by assets) was 0.90 for the same period. Sutron Corporation (NASDAQ:STRN) has the 10th highest Return on Assets in this segment of the market. Its ROA was 14.36% for the last 12 months. Its Asset Turnover ratio (revenue divided by assets) was 1.24 for the same period.

tdp2664
China Analyst
Top 10 Industrial Stocks with Highest Return on Assets: CVVT, NFEC, RAVN, CWS, GGG, DNEX, FAST, OFLX, MMM, STRN (Oct 30, 2010)


Monster Worldwide Inc. (MWW) Finishes Higher after Q3 Results

Monster Worldwide Inc. (NYSE: MWW) shares rallied in today's trading after the company reported its third-quarter financial results. Shares ended the day 25.50% higher at $18.06 on above average volume of 20.98 million. The stock touched a 52-week high of $19.10. The stock has a 52-week range of $10.01-$19.10. Yesterday, the company announced third quarter fiscal 2010 results, with revenues at $229.0 million, an increase of 7% as compared to previous year. The revenues showed the growth due to increased bookings of 26% to $235.0 million, or 23% excluding HotJobs, and a sequential improvement in deferred revenue. The net loss was $5.7 million, or $0.05 per share, as compared to net income of $33 million, or $0.27 per share, in the third quarter of 2009, which included a favorable tax adjustment of $31.0 million, or $0.26 per share. The company expects the revenue in range of $258.0 – $272.0 for fourth quarter 2010 and $919.0 -$933.0 for full year 2010. The bookings are expected in range of $328.0 – $342.0 for fourth quarter 2010 and $990.0 – $1,004.0 for full year 2010. Monster provides a global online employment solution. Disclaimer: The assembled information distributed by epicstockpicks.com is for information purposes only, and is neither a solicitation to buy nor an offer to sell securities. Epicstockpicks.com does expect that investors will buy and sell securities based on information assembled and presented herein. EpicStockPicks.com will not be responsible in any way for or accept any liability for any losses arising from an investor's reliance on or use of information obtained from our website or emails. PLEASE always do your own due diligence, and consult your financial advisor.
tdp2664
Epic Stock Picks


6 Stocks With Dividend Increases This Week

Last week's list of stocks increasing dividends was little light, but some big names have come out of the woodwork in dividend stock news recently. Gold miner GoldCorp Inc. (NYSE: GG ) doubled its dividend, food products blue chip Sara Lee (NYSE: SLE ) added to its already plump yield and some important small-cap tech stocks got in on the action, too.  Here's this week's roundup of the latest dividend increases and high-yield dividend stocks: Sara Lee Dividend Increase On Thursday, food-products giant Sara Lee (NYSE: SLE ) declared a quarterly dividend of 11.5 cents per share, an increase of about 5% over its prior dividend of 11 cents per share. The bump now gives Sara Lee a yield of about 3.2%. Sara Lee is currently interviewing executives for its top spot, but that open position hasn't held back shares. The blue-chip stock is up about 20% year to date, compared with just about 7% for the S&P 500 index. The stock rallied this fall on rumors of a buyout, but talks with Apollo Global Management have reportedly fallen through. GoldCorp Dividend Increase GoldCorp Inc. (NYSE: GG ) reported earnings this week that were quadruple last year's numbers. No surprise, given how gold prices have been on a tear. And investors have even more to be happy about as the gold-mining stock reported a dramatic doubling of its dividend yield. -GoldCorp increased its quarterly dividend from 4.5 cents a share to 9 cents a share. That gives the gold company a dividend yield of 0.8%. Since GG just paid a dividend on Oct. 22, it will be another three months until this higher yield turns up in payouts. GoldCorp stock is up about 13% year-to-date, double the S&P 500 index in 2010. Perrigo Dividend Increase Health-care mid cap Perrigo Co. (NASDAQ: PRGO ) isn't quite a dividend heavyweight, but it's worth noting the company’s 12% increase in its quarterly payday from 6.25 cents to 7 cents a share. That gives the stock a new yield of about 0.7%. The dividend is payable Dec. 14 to shareholders of record Nov. 26. Perrigo has had a breakout 2010, with gains of about 68% so far this year. The company will announce third-quarter earnings Nov. 2 and is expected to see 15% to 20% EPS growth. Evercore Dividend Increase Evercore Partners (NYSE: EVR ), an independent investment banking advisory firm, has cashed in big time as cash-rich companies have been on a spree of mergers and acquisitions. Evercore had a 48% jump in third-quarter revenue, and a significant 20% bump to its dividend from 15 cents a share to 18 cents. EVR has also authorized a 2 million-share buyback program. Evercore now has a dividend yield of about 2.3%. The small-cap company has struggled in 2010, posting a loss year to date despite a gain for the broader markets. However, since July 1 Evercore is up about 30% and its recent strong earnings report may signal better times ahead. AEP Dividend Increase Utility stock American Electric Power (NYSE: AEP ) has signed off on a 9.5% quarterly dividend increase, from 42 cents to 46 cents a share.  That gives AEP stock a dividend yield just shy of 5%. The next payout from the Ohio utility stock will be Dec. 10 to shareholders of record Nov. 10. The American Electric Power board formalized the dividend increase this week, after previous hints it would do so. Rumblings of an increase emerged after a strong third-quarter report earlier in October that included a 25% jump in earnings. Shares of AEP stock are up about 15% since July 1. DDi Dividend Increase Circuit board small cap DDi Corp. (NASDAQ: DDIC ) may be modest in size, but its dividend yield is now one of the best in the tech sector. After strong third-quarter earnings, DDi boosted its dividend from 6 cents a share to 10 cents a share,  a 66% increase. DDIC stock now has a dividend yield of just over 4%. DDi also had some good earnings news Thursday.  DDIC saw net sales jump 27% over last year, while income increased by about 8%. DDi shares have doubled so far in 2010, and it appears that the big profits are far from over if it is confidence enough for big payout increase. In other dividend stock news:  Moody’s (NYSE: MCO ) maintained its quarterly dividend of 10.5 cents per share and dividend yield of 1.6%. Thomson Reuters (NYSE: TRI ) maintained its quarterly dividend of 29 cents per share and its dividend yield of 3.0%. Willis Group Holdings (NYSE: WSH ) maintained its quarterly dividend of 26 cents per share and dividend yield of 3.2%. DPL Inc. (NYSE: DPL ) maintained its quarterly dividend of 30.25 cents per share and dividend yield of 4.5%. Jeff Reeves is editor of InvestorPlace.com. As of this writing, he did not own a position in any of the stocks named here. Follow him on Twitter at http://twitter.com/JeffReevesIP .
tdp2664
gol2664
InvestorPlace


Market News: Delta Air Lines (NYSE:DAL), Johnson & Johnson (NYSE:JNJ), Intel Corp. (NASDAQ:INTC)

Here are some more breaking stock news briefs which could see some changes on the markets later. The following companies should see some movement: Delta Air Lines (NYSE:DAL), Johnson & Johnson (NYSE:JNJ), Intel Corp. (NASDAQ:INTC). Here is a more detailed look at the news that will affect each company when trading continues. Delta Air Lines (NYSE:DAL) Delta Air Lines (NYSE:DAL) has made a number of performance changes to its schedules, including discontinuing its service to Hilton Head Island Airport. Delta Air Lines (NYSE:DAL) already conducted a similar suspension last year. Delta Air Lines (NYSE:DAL) is also suspending its service to Florence and two other locations outside South Carolina. Joe Esposito, the managing director of Delta Air Line's (NYSE:DAL) network planning said, "Flights have experienced a significant decline in revenues and passenger loads this year. That, combined with decisions to phase out aging aircraft Delta flies in and out of Hilton Head prompted the decision. Although Delta would prefer to continue serving the market, we have made the difficult decision to eliminate our Hilton Head Airport service as part of our efforts to retire less-efficient turboprop and small jet aircraft from the Delta Connection fleet." Johnson & Johnson (NYSE:JNJ) A new investigation into a factory will be launched by Johnson & Johnson (NYSE:JNJ) in South Korea. Johnson & Johnson (NYSE:JNJ) have said that they will look into all possible contamination issues of a South Korean drug facility owned by a company which they are acquiring. At the beginning of this month, Johnson & Johnson (NYSE:JNJ) had announced the purchase of Crucell for about $2.41 billion, which will allow the company to gain a foothold in the coveted vaccine business. Crucell is a major vaccine supplier to UNICEF and developing countries. It also develops medicines that use antibodies to zero in on organisms causing infectious diseases. Intel Corp. (NASDAQ:INTC) A new factory in Vietnam is the latest step by Intel (NASDAQ:INTC) into the East. It is Vietnam’s first semiconductor factory, which produces chipsets for mobile devices and laptops. The company first had plans to construct the plant in China, but several reasons made it shift to Vietnam. Some called the move 'courageous', as the decision to build the plant was in 2006, in a country without a single world-class university – ahead of countries like India and China. The plant will help provide job for around 85,000 employees. Intel’s former country manager in Vietnam said that “Vietnam has the potential to be a small China in tech manufacturing.” We may see more movement when trading continues for Delta Air Lines (NYSE:DAL), Johnson & Johnson (NYSE:JNJ) and Intel Corp. (NASDAQ:INTC).
tdp2664
E money daily


Top 10 U.S.-Listed Chinese Stocks of the Week: PSOF, GRRF, FFHL, KUTV, CADC, GPRC, PWRD, JKS, IDI, NPD (Oct 30, 2010)

Below are the top 10 best-performing U.S.-listed Chinese stocks for the past week.

Pansoft Company Limited (NASDAQ:PSOF) is the 1st best-performing stock last week in this segment of the market. It was up 41.11% for the past week. Its price percentage change is -2.31% year-to-date. China GrenTech Corporation Limited (ADR) (NASDAQ:GRRF) is the 2nd best-performing stock last week in this segment of the market. It was up 29.86% for the past week. Its price percentage change is -18.70% year-to-date. Fuwei Films (Holdings) Co., Ltd (NASDAQ:FFHL) is the 3rd best-performing stock last week in this segment of the market. It was up 22.63% for the past week. Its price percentage change is 37.70% year-to-date. Ku6 Media Co., Ltd. (ADR) (NASDAQ:KUTV) is the 4th best-performing stock last week in this segment of the market. It was up 19.10% for the past week. Its price percentage change is 37.04% year-to-date. China Advanced Con. Materials Gr. Inc (NASDAQ:CADC) is the 5th best-performing stock last week in this segment of the market. It was up 19.05% for the past week. Its price percentage change is -4.62% year-to-date.

Guanwei Recycling Corp. (NASDAQ:GPRC) is the 6th best-performing stock last week in this segment of the market. It was up 15.88% for the past week. Its price percentage change is 25.08% year-to-date. Perfect World Co., Ltd. (ADR) (NASDAQ:PWRD) is the 7th best-performing stock last week in this segment of the market. It was up 15.67% for the past week. Its price percentage change is -17.85% year-to-date. JinkoSolar Holding Co., Ltd. (NYSE:JKS) is the 8th best-performing stock last week in this segment of the market. It was up 15.56% for the past week. Its price percentage change is N/A year-to-date. SearchMedia Holdings Limited (AMEX:IDI) is the 9th best-performing stock last week in this segment of the market. It was up 15.27% for the past week. Its price percentage change is -64.70% year-to-date. China Nepstar Chain Drugstore Ltd. (NYSE:NPD) is the 10th best-performing stock last week in this segment of the market. It was up 13.62% for the past week. Its price percentage change is -33.61% year-to-date.

tdp2664
China Analyst
Top 10 U.S.-Listed Chinese Stocks of the Week: PSOF, GRRF, FFHL, KUTV, CADC, GPRC, PWRD, JKS, IDI, NPD (Oct 30, 2010)


Gold and 12 Zeroes, Part I

Paul Volcker wrung inflation out of the system. Ben Bernanke is wringing cash-savers’ necks…

AS WE NEVER TIRE of boring anyone who’ll listen here at BullionVault, it’s not inflation alone that makes Gold Prices rise, writes head of research Adrian Ash.

If it were, the last decade’s four-fold rise would be missing, and gold wouldn’t have dropped by three-quarters during the 1980s and ’90s.

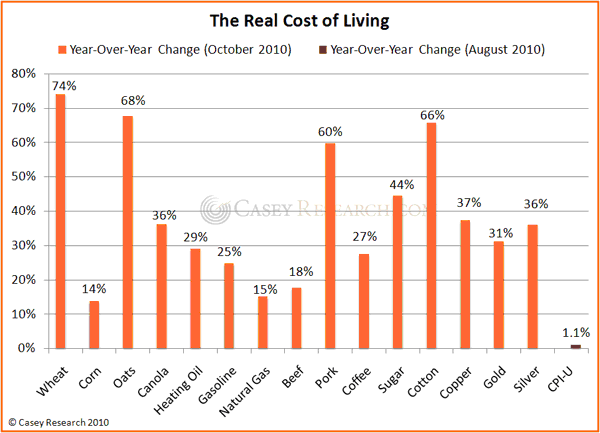
Sure, the cost of living has increased since 2001 – no doubt about that. And yes, the real value of money has contracted as global money supplies have surged. But the pace of change doesn’t compare with the 25% suffered by UK consumers in 1978, nor the 8% annual average hitting US consumers between 1971 and the end of 1980.

So the common link between the 1970s and the last decade of rising Gold Prices is a little more complex than inflation alone. But only a little.

Because it’s the failure of interest rates to keep pace with inflation that matters.
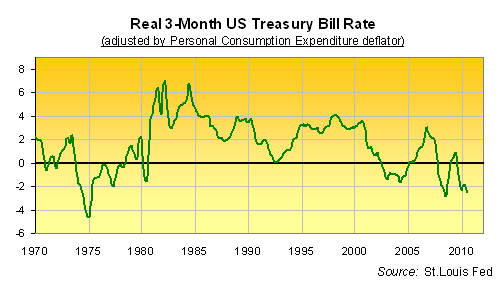
Check this…

  • The 1970s saw 3-month Treasury bills pay an average of 0.1% per year less than domestic US inflation. That decade saw gold prices rise 24 times over vs. the Dollar;
  • The 1980s and ’90s then saw 3-month bill rates average 3.1% more than inflation each year. Gold Prices fell by 81%;
  • The last 11 years have since seen real T-bill rates sink alongside Federal Reserve rate and longer-term Treasury bond yields, averaging just 0.3% since Jan. 2000. Gold has risen 450% low-to-peak.
  • Most recently – and thanks as much to the flight-to-safety after Lehmans collapsed as to Ben Bernanke’s response – real rates have now averaged fully 1.0% below US inflation since the global financial crisis began in summer ’07. Professional wholesale dealers meantime ask 1,350 US Dollars for an ounce of gold, up from $649 before the crisis broke.

A caveat: You shouldn’t try trading in and out of Gold Bullion using this indicator. That plunge in real rates on the chart above, for instance, of early 1980 proved a feint, as investors soon discovered after piling back into gold when it bounced from a 40% plunge. Similarly, the rise in real rates of 2006 didn’t make for a sell signal. The underlying trend, it turned out, was still down for rates…and up for gold. And short term, plenty of other factors can get in the way as well – be it mid-term US elections, the Indian festival season, or a global guessing-game of whether the Fed will print eleven or twelve zeroes after the figure $1 when it meets next week.

That policy, remember, is designed to mimic an interest-rate cut. Because interest rates already have already been slashed to zero, known as the “lower bound” amongst policy wonks, who now feel they need to somehow overcome the “zero bound” by printing money to help devalue it faster. Goldman Sachs reckons that, creating $4 trillion next Wednesday, would be “equivalent to a cut in interest rates of 3%”. Even so, the investment bank’s analysts complain that we’ll probably get a measly $2 trillion instead.

So, let’s take the vampire squid at its word, and imagine that the Fed goes for a two and twelve zeroes – whether immediately, or dripped out of Washington over a period of months. On Goldman’s maths, that would eat a further 1.5% off the real rate of interest (not) being paid by 3-month T-bills…and so such a move (and notional outcome) would take real returns down to minus 3.9%.

For US savers, that would be the worst level of real returns to cash since the start of 1975, back when US inflation was running above 10%. That same month, almost 36 years ago, the Gold Price hit what proved an intermediate peak, slipping by almost one-half as real interest rates then climbed up towards zero. (Like we said, real rates aren’t a dead-set signal for short-term direction.)

Real returns paid to cash then failed at zero, however, and slipped back – while gold rose 8-fold again – before the Volcker Fed finally set about “wringing inflation out of the system” in mid-1980 with double-digit overnight rates.

If you expect Ben Bernanke to wring anything but cash-savers’ necks in the next year, then please – go ahead and sell Gold Bullion. And if you want to know what happens if inflation subsides, as he keeps claiming it will, watch out for Part II next week.

Get the safest gold at the lowest prices by using BullionVault today…

gol2664


Nana Sangmuah: African Takeouts on the Menu

gol2664

Nana Sangmuah: African Takeouts on the Menu NASDAQ – Oct 29, 2010 Clarus Securities Analyst Nana Sangmuah was born in Ghana, West Africa-a growing hot spot for gold exploration. He believes several gold juniors operating in West Africa are prime takeover targets …


Apple (AAPL) Now No. 4 Mobile Phone Vendor

Here is your daily Apple (NASDAQ: AAPL ) stock news and rumors for Oct. 29, 2010. Good news for Apple shareholders today as the IDC reports that Apple has become the No. 4 mobile phone —  not just smartphone — manufacturer in the world, bumping Research in Motion down to No. 5 and knocking Sony Ericsson down to No. 6.  Meanwhile, Steve Jobs’ company continues to ramp up its presence in among enterprise customers as distributor Ingram Micro begins offering the iPad. And speaking of its financial successes, Apple has finally surpassed Microsoft in quarterly revenue. Apple Becomes No. 4 Mobile Phone Vendor, Surpasses Research in Motion:   Apple has broken into the top five list of global mobile-phone vendors for the very first time,  according to new results from the IDC Worldwide Quarterly Mobile Phone Tracker reported by BusinessWire.  The category is all mobile phones, not just smartphones or connected devices. In the third quarter of 2010, Apple finally surged ahead of BlackBerry manufacturer Research in Motion (NASDAQ: RIMM ) and displaced Sony Ericsson (NYSE: SNE , NASDAQ: ERIC) from the top five.  Apple still trails Nokia (NYSE: NOK ), Samsung   and LG Electronics. IDC senior research analyst Kevin Restivo stressed that  Apple’s 90.5% increase in year-on-year sales in the third quarter of 2010 demonstrated the increased importance of smartphones in the global mobile phone market. While Apple beat  Research in Motion, RIMM also saw impressive growth, with a 45.9% year-on-year jump in sales during the same period. Some 340.5 million mobile phones were shipped between July and September 2010 compared with 297.1 million in the year prior. iPad Sales Grow in Enterprise Markets Says Distributor: Apple distributor Ingram Micro (NYSE: IM ) told Reuters this week that Apple has given the company the OK  to begin selling the iPad to businesses as enterprise markets show increasing interest in the popular tablet computer. Ingram Micro CEO Greg Spierkl said that Apple itself has been surprised by the opportunity for business to business sales of the iPad considering that the device was targeted predominantly at consumers when it launched earlier this year. Since Apple announced quarterly earnings, Apple executives have emphasized the iPad’s success with enterprise buyers. Apple claimed that more than 65% of the Fortune 100, including companies like General Electric (NYSE: GE ) subsidiary NBC Universal and Hyatt Hotels (NYSE: H ), have begun using the iPad in daily operations. Apple also announced a new partnership with Unisys (NYSE: UIS ) to provide service to enterprise clients. If iPad sales continue to grow as predicted, hitting more than 14 million units sold by the end of the calendar year, it’s possible that Apple will take a dominant position in the business sector before competitors like Hewlett-Packard (NASDAQ: HPQ ) can even get their tablets to market. Microsoft Falls Behind Apple in Third-Quarter Revenues: Last summer, Apple was declared the most valuable technology company — largest by market capitalization – on the planet, finally surpassing Microsoft (NASDAQ: MSFT ) after a decade of growth thanks to its line of successful portable computing devices like the MacBook, iPod, iPhone, and most recently, the iPad.  Apple did not, however, pull in more revenue than Microsoft in the April-through-June quarter. The same can’t be said of the July-to-September period, though, as Apple’s revenue finally surged ahead of Microsoft’s. Reporting $20.34 billion in revenue, Apple trounced Microsoft, which pulled in just $16.20 billion during the third quarter of 2010. Not only did Apple beat Microsoft but it also outdid Microsoft’s best-ever quarterly performance of $19 billion. As of this writing, Anthony Agnello did not own a position in any of the stocks named here.
tdp2664
gol2664
InvestorPlace


Nasdaq 3 Most Active Stocks (MU, PWER, VVUS)

Micron Technology Inc. (NASDAQ: MU) shares traded higher today. The stock ended the day 3.97% higher at $8.26, on above average volume of 86.40 million. The stock touched an intra-day high of $8.27. The stock has a 52-week range of $6.12-$11.40. Power-One Inc. (NASDAQ: PWER) shares fell after the company reported its third-quarter financial results. The stock ended the day 6.38% lower at $10.42, on above average volume of 38.57 million. The stock touched an intra-day low of $10.20. The stock has a 52-week range of $2.52-$13.04. Yesterday, the company announced its results for third quarter fiscal 2010, with revenues of $314.0 million, an increase of 214% from the third quarter 2009. VIVUS Inc. (NASDAQ: VVUS) shares saw a big jump in today's trading. The stock ended the day 26.43% higher, on above average volume of 27.23 million. The stock touched an intra-day high of $8.39. The stock has a 52-week range of $4.69-$13.68. Yesterday, the company announced the receipt of Complete Response Letter (CRL) from the U.S. Food and Drug Administration (FDA) regarding its new drug application (NDA) for the investigational new drug QNEXA (phentermine/topiramate) controlled-release capsules. Disclaimer: The assembled information distributed by epicstockpicks.com is for information purposes only, and is neither a solicitation to buy nor an offer to sell securities. Epicstockpicks.com does expect that investors will buy and sell securities based on information assembled and presented herein. EpicStockPicks.com will not be responsible in any way for or accept any liability for any losses arising from an investor's reliance on or use of information obtained from our website or emails. PLEASE always do your own due diligence, and consult your financial advisor.
tdp2664
Epic Stock Picks


VIVUS, Inc. (VVUS) Shares Jump 26%

VIVUS, Inc. (NASDAQ:VVUS) shares jumped 26.43% to $7.75 on Friday after the company announced that it received a Complete Response Letter (CRL) from the U.S. Food and Drug Administration (FDA) regarding its New Drug Application (NDA) for the investigational new drug QNEXA® (phentermine/topiramate) Controlled-Release Capsules. The FDA decided that the NDA cannot be approved in its present form. The application seeks the approval to market QNEXA as an oral, once-a-day formulation for the treatment of obesity, including weight loss and maintenance of weight loss, in patients who are obese or overweight with co-morbidities such as hypertension, type 2 diabetes, dyslipidemia or central adiposity. FDA requested a comprehensive assessment of topiramate’s and phentermine/topiramate’s teratogenic potential asking asked VIVUS to provide evidence that the elevation in heart rate associated with phentermine/topiramate does not increase the risk for major adverse cardiovascular events. The FDA requested that VIVUS formally submit the results from the already completed SEQUEL study (OB-305), a 52-week extension study for a subset of 675 patients who completed the previously reported 56-week CONQUER study. Top-line results from the two-year SEQUEL study were announced by VIVUS on September 21, 2010 and a final study report is being prepared for submission to the NDA. Finally, the FDA stated that if approved, phentermine/topiramate would be a Schedule IV drug due to the phentermine component. Leland Wilson, chief executive officer of VIVUS stated that the company remains confident in the efficacy and safety profile of QNEXA demonstrated in the clinical development program and looks forward to continue working with the FDA towards the approval for the treatment of obesity. VIVUS is a biopharmaceutical company developing therapies to address obesity, sleep apnea, diabetes and male sexual health. The company’s lead product in clinical development is QNEXA®, which also is in phase 2 clinical development for the treatment of type 2 diabetes and obstructive sleep apnea. In the area of sexual health, VIVUS is in phase 3 development with avanafil, a PDE5 inhibitor being studied for the treatment of erectile dysfunction.
tdp2664
Newsworthy Stocks


TODAY’S STOCK MARKET DOW JONES INDUSTRIAL AVERAGE DJI, NYSE, S&P 500, NASDAQ INDEX TRENDS, NOTES October 30th, 2010 Week’s Review

dow2664

Anticipation continues that the Federal Reserve will launch a plan to purchase government bonds in an attempt to make loans cheaper and prompt lending, spending and economic growth. Hopes for a swift and intense intervention are getting smaller as reports and economic data portray a recovery that continues to move slowly, but in the right direction. Yesterday, The Commerce Department reported that the economy expanded at a 2% annual rate in the July through September quarter. Consumers were busy helping to increase spending growth values. These posted values revealed a 2.6% growth in spending, up from the 2.2% growth value posted in the second quarter. This represents a continuation of the slow economic recovery trends. Index values finished the last week in October mostly in the green. The Nasdaq, NYSE and Dow Jones Industrials ended the week on a positive note and the Dow Jones Industrials had one of it’s best Octobers in years. The Dow rose 3% in October, the S&P 500 rose 4% and the Nasdaq rose 6% for the month. The dollar strengthened against the euro but lost ground to the British pound and the Japanese yen. The ten year treasury yield ended the week at 2.6% as U.S. Treasury’s closed out the week on the rise. Author: Frank Matto

TODAY'S STOCK MARKET DOW JONES INDUSTRIAL AVERAGE DJI, NYSE, S&P 500, NASDAQ INDEX TRENDS, NOTES October 30th, 2010 Week's Review


Nasdaq 100

dow2664

This week's SBV chart example is based on the 15-day SBV(20) Nasdaq 100 (^NDX) chart. +46 points on the Nasdaq 100 Chart 1. Relationship between the SBV Oscillator and index reversal points. Nasdaq 100 index. 15-day view. 1 bar = 15 minutes. SBV(20) In our trading example, we applied the following simple system which is based on our SBV indicator: Once the SBV indicator has fallen below a negative signal level (the indicator will now show red), we will enter a short position (if we are not already short); Once the SBV indicator has advanced above a negative signal level (after having been below that level), we will enter a long position (the indicator still shows red); Once the SBV indicator has rallied above a positive signal level (the indicator will now show green), we will enter a long position (if we are not already long); Once the SBV indicator has fallen below a positive signal level (after having been above that level), we will enter a short position (the indicator still shows green); Additional Stop Loss Rule – If the SBV had dropped into negative territory and has begun to rise without having hit the signal line, close the short position when the SBV is back in positive territory, and stay in cash until a new signal appears. Do the opposite for a long position: if the SBV had moved into positive territory and has begun to decline without having hit the positive signal line, close the long position when the SBV is back in negative territory, and stay in cash until a new signal appears. Detailed system description with explanation of used rules could be found in our ” SBV Trading System ” tutorial. Table 1: Trades based on the 5-rule system. Time Motivation Signal Index Profit (points) 10/12/2010 Rule #2 Buy 2031 +27 10/13/2010 Rule #4 Sell Short 2058 -14 10/15/2010 Rule #2 Buy 2072 +23 10/18/2010 Rule #4 Sell Short 2095 +14 10/19/2010 Rule #2 Buy 2081 -4 10/19/2010 Rule #4 Sell Short 2077 -16 10/20/2010 Rule #2 Buy 2093 -7 10/20/2010 Rule #4 Sell Short 2086 -8 10/22/2010 Rule #2 Buy 2094 +26 10/25/2010 Rule #4 Sell Short 2120 +2 10/25/2010 Rule #5 Cash 2118 10/27/2010 Rule #4 Sell Short 2117 +1 10/27/2010 Rule #2 Buy 2116 0 10/28/2010 Rule #4 Sell Short 2116 -11 10/28/2010 Rule #3 Buy 2127 +5 10/29/2010 Rule #4 Sell Short 2132 +8 Total: +46 (+2.3%) Note: The 20% level for the SBV indicator was determined in relation to the prevailing market conditions at the time that the trading examples were selected. In order to establish the optimal critical levels for the SBV indicator, traders should consider the current market situation and review the history of prior volume surges, including their magnitude (i.e., the level that the SBV indicator reached). Our charts are unique in that they give traders the opportunity to choose the specific chart settings that best fit their personal trading styles and risk tolerances. Traders can thus develop and test their own trading systems. On our charts, you can scroll back in history to test any system that you have created. Disclaimer: The chart example is intended for educational purposes only and does not constitute trading advice or make or imply any market trend prediction.

Nasdaq 100


Monday Morning Outlook: DJIA Settles into Holding Pattern Ahead of Fed, Election

dow2664

Monday Morning Outlook: DJIA Settles into Holding Pattern Ahead of Fed, Election Schaeffers Research – 5 hours ago by Todd Salamone 10/30/2010 11:15 AM The Dow Jones Industrial Average managed another close above the 11,100 level last week, but traders were evidently holding their fire ahead of the midterm …

Monday Morning Outlook: DJIA Settles into Holding Pattern Ahead of Fed, Election


Marijuana Legalization Stocks

dow2664

On Tuesday, November 2, California residents will be voting on Proposition 19, the ballot measure that, if passed, would legalize limited quantities of marijuana for recreational use. This has created plenty of fodder for news reports. The New York Times just reported on the marijuana related domain name land grab. UPI reported that a marijuana dispensary in San Francisco would give away free joints whenever the Giants hit a home run during the World Series. And to top it off, The Wall Street Journal posted an editorial by billionaire investor George Soros, in which he says he supports the legalization of marijuana . Unfortunately, most of the plays on legalization involve very low cap stocks, according to the list of 20 marijuana stocks at WallStreetNewsNetwork.com. However, for the medical use of marijuana and its derivatives, there are larger companies that produce such products as Marinol, a trademark of Solvay SA (SVYSF.PK) and Nabilone, marketed as Cesamet by Valeant Pharmaceuticals International (VRX), which trades on the New York Stock Exchange. Nabilone, a synthetic cannabinoid, is used to treat chemotherapy-induced nausea and vomiting, anorexia, and weight loss in AIDS patients. Valeant also markets Fluorouracil, a cancer treatment drug, and Diastat, a seizure drug. This $4.38 billion market cap stock trades at 30 times earnings, and pays a yield of 1.4%. Earnings for the latest reported quarter were up 41% year over year on a 23% increase in revenues. The company will have its next earnings announcement on November 4. Par Pharmaceutical Companies (PRX), a $1.14 billion market cap company markets Dronabinol, a form of Tetrahydrocannabinol or THC. However, this is a small part of the business as the company markets dozens of other drugs. The stock has a PE ratio of 13.9 and trades at one times sales. Earnings will be reported November 3. GW Pharmaceuticals (GWPRF.PK) produces Sativex, an oral spray with tetrahydrocannabinol and cannabidiol, which is used to treat multiple sclerosis patients, and also for treating pain in cancer patients. Earnings for the quarter ending March 31 were negative. The company will be reporting earnings on November 23. To see the complete free list of twenty marijuana stocks , which shows the symbol, PE ratio, price sales ratio, yield, market capitalization, and business description, go to WallStreetNewsNetwork.com. Disclosure: Author didn’t own any of the above stocks at the time the article was written. By Stockerblog.com

Marijuana Legalization Stocks


LinkWithin

Related Posts Plugin for WordPress, Blogger...