PharmAthene, Inc. (AMEX:PIP) plunged 14% to $3.51 on unusual volumes. The company announced that it has priced a registered public offering of 4,300,000 shares of its common stock at a price to the public of $3.50 per share. In connection with the offering, the Company also granted the underwriter a 30-day option to purchase up to an additional 645,000 shares to cover over-allotments, if any. The offering is expected to close on or about November 3, 2010. The stock traded within the range of $3.50-$3.63. At closing market price, the market capitalization of the company stands at $115.02 million. General Moly, Inc. (AMEX:GMO) soared 20.93% to close at $5.20 after it made its fresh 52-week high of $5.24. The company said it has a net loss of $6.3 million or $0.09 per share in its third quarter. Consolidated cash balance at the end of the third quarter was approximately $17 million compared to approximately $23 million at the end of the second quarter and approximately $49 million at the end of 2009. The stock went up more than 150% year-to-date. The 52-week range of the stock is $1.85-$5.24. KEMET Corporation (AMEX:KEM) jumped 10.95% to $3.75. The Company posted second quarter 2011 results. The company reported that its net income jumped to $34.3 million or $0.42 a basic share from $0.22 a share a year ago period. Revenue grew 43.5% to $248.6 million from $243.8 million in a year ago quarter. The stock opened at $3.37 and traded within the range of $3.37-$3.83. Over the past five trading sessions, the stock went up more than 25%. Disclaimer: The assembled information distributed by epicstockpicks.com is for information purposes only, and is neither a solicitation to buy nor an offer to sell securities. Epicstockpicks.com does expect that investors will buy and sell securities based on information assembled and presented herein. EpicStockPicks.com will not be responsible in any way for or accept any liability for any losses arising from an investor's reliance on or use of information obtained from our website or emails. PLEASE always do your own due diligence, and consult your financial advisor.
tdp2664
Epic Stock Picks
Sunday, October 31, 2010
Top AMEX Stock Movers (PIP, GMO, KEM)
AIG Scores with Hong Kong IPO for AIA
American International Group, Inc. (NYSE: AIG ) earlier this year rejected an offer of $30.5 billion from Britain’s Prudential PLC (NYSE: PUK ) for its Asian insurance division American International Assurance Group Ltd., known as AIA. AIG decided instead to pursue an IPO on the Hong Kong exchange, and that offering is now in the books. The IPO valued AIA at about $30.6 billion, but of that AIG gets only about $17.8 billion. By any measure the IPO was a smashing success. The shares went out at HK$19.68 (about $2.96) and closed the morning session at HK$22.95. The shares are over HK$23 currently. Bloomberg Businessweek has reported that gray market shares of AIA traded at around HK$21.50 before the IPO. Originally slated for 5.86 billion shares, the offering grew by 1.17 billion shares on strong demand from investors. AIG also retains an option to sell another 1.05 billion shares, which would reduce its remaining stake in AIA from 42% to about 33%. Under the terms of the IPO, AIG cannot exercise its option for six months and must maintain a minimum 30% stake for one year. AIG’s take if it exercises its option could total as much as $20.5 billion. AIG plans to use its proceeds to pay off part of the $46 billion it still owes to the Federal Reserve Bank of New York. AIA had commitments from five cornerstone investors totaling $1.9 billion. The largest piece came from the Kuwaiti sovereign wealth fund, which put up $1 billion. Malaysia’s Guoco Group Ltd. and Hong Leong Group committed a total of $420 million and Malaysia’s government retirement fund invested $200 million. Two Hong Kong investment companies and Hong Kong’s Wharf Holdings Ltd. put up the remaining $300 million. The IPO was the second largest this year, trailing only the massive $22.1 billion IPO of China’s Agricultural Bank of China. The Wall Street Journal noted that the retail tranche of the IPO was oversubscribed by more than nine times, and the institutional tranche was oversubscribed by nearly eight times. The AIA offering was part of an overall plan agreed to by AIG and the federal government that would repay US taxpayers most, if not all, the $180 billion or so poured into AIG following the financial crisis of 2008.
tdp2664
gol2664
InvestorPlace
Weekly News Roundup: Dow Chemical (NYSE:DOW)
Here are this week’s news briefs for Dow Chemical (NYSE:DOW). Dow Chemical (NYSE:DOW) stocks ended the week at 30.84 (as of 10/29/2010). Weekly News Roundup: Dow Chemical (NYSE:DOW) Tuesday 26 October Dow Chemical (NYSE:DOW) has recognized the winners in the Sustainability Innovation Student Challenge held at Tufts University in Boston. The students have been awarded for their innovation and commitment for providing sustainable solutions to social, economic, and environmental problems. Neil Hawkins Dow Chemical (NYSE:DOW) Vice President of Sustainability and Environment, Health and Safety said, "I speak for everyone at Dow Chemical (NYSE:DOW) when I say how proud we are to recognize the innovative thinking and collaboration showcased among a new generation of scientists and leaders collectively working toward a more sustainable future." Friday 29 October Dow Chemical (NYSE:DOW) has improved its third-quarter performance. Dow Chemical's (NYSE:DOW) sales rose on stronger demand and saw an overall price increase of 9 percent. The third quarter results showed a solid recovery, beating analyst's forecasts for the company's earning. Andrew Liveris, Dow Chemical's (NYSE:DOW) chairman and chief executive, said, "These results clearly demonstrate our strategy is continuing to deliver and that we have regained our momentum to transform Dow Chemical (NYSE:DOW) into an earnings growth company." We will continue checking the Dow Chemical (NYSE:DOW) stock level for developments over the next couple of weeks.
tdp2664
E money daily
TODAY’S STOCK MARKET DOW JONES INDUSTRIAL AVERAGE DJI, S&P 500, NASDAQ INDEX TRENDS, NOTES October 29th, 2010 Mid Day
dow2664
The market closed flat on Thursday and stocks continue this trend into Friday afternoon. Corporate third quarter results continue to report better than expected earnings but mixed affects on stocks. Multiple reports were anticipated today on the economic calendar. The government released the initial results of its third quarter gross domestic product (GDP). The GDP is used to measure the nations economic activity. The government reports the third quarter GDP rose at an annual rate of 2%. This was higher than the last report three months ago at 1.7%, but indicates growth at a sluggish rate. The Bureau of Labor Statistics reported the compensation for civilian workers increased 0.4% in the third quarter. The Michigan consumer sentiment index was reported to decline from 67.9 last month to 67.7, falling short of the anticipated 68. Investors report increased uncertainty at this time with so many mixed third quarter results and they continue to speculate what measures the Fed will take and how the Nov. 2 elections may affect the economy. Until there are some definitive answers, reports indicate the market will continue to be choppy. Currently the markets are in the green approaching close. NASDAQ is up 9.83 points to 2,517.19. S&P 500 is up 1.18 to 1,184.96. DJIA is up 8.77 to 11,122.72. The Treasurys 10-year yield is down 0.04 to 2.62%. Oil is down 1.02 to $81.18 a barrel. Author: Pamela Frost
Top 10 U.S.-Listed Chinese Stocks with Highest Return on Assets: GPRC, HGSH, SCOK, CNET, CJJD, CYOU, BIDU, CNGL, SINA, PWRD (Oct 31, 2010)
Below are the top 10 U.S.-listed Chinese stocks with highest Return on Assets ratio (ROA) for the last 12 months, UPDATED TODAY before 4:30 AM ET. ROA shows a company's efficiency in making profits from its assets. It is equal to net profits divided by total assets.
Guanwei Recycling Corp. (NASDAQ:GPRC) has the 1st highest Return on Assets in this segment of the market. Its ROA was 69.37% for the last 12 months. Its Asset Turnover ratio (revenue divided by assets) was 3.73 for the same period. China HGS Real Estate, Inc. (NASDAQ:HGSH) has the 2nd highest Return on Assets in this segment of the market. Its ROA was 56.88% for the last 12 months. Its Asset Turnover ratio (revenue divided by assets) was 1.48 for the same period. SinoCoking Coal and Coke Chem Ind, Inc. (NASDAQ:SCOK) has the 3rd highest Return on Assets in this segment of the market. Its ROA was 56.74% for the last 12 months. Its Asset Turnover ratio (revenue divided by assets) was 0.86 for the same period. ChinaNet Online Holdings Inc (NDA) (NASDAQ:CNET) has the 4th highest Return on Assets in this segment of the market. Its ROA was 43.32% for the last 12 months. Its Asset Turnover ratio (revenue divided by assets) was 1.89 for the same period. China Jo Jo Drugstores Inc (NASDAQ:CJJD) has the 5th highest Return on Assets in this segment of the market. Its ROA was 43.02% for the last 12 months. Its Asset Turnover ratio (revenue divided by assets) was 2.56 for the same period.
Changyou.com Limited(ADR) (NASDAQ:CYOU) has the 6th highest Return on Assets in this segment of the market. Its ROA was 42.11% for the last 12 months. Its Asset Turnover ratio (revenue divided by assets) was 0.78 for the same period. Baidu.com, Inc. (ADR) (NASDAQ:BIDU) has the 7th highest Return on Assets in this segment of the market. Its ROA was 37.86% for the last 12 months. Its Asset Turnover ratio (revenue divided by assets) was 0.91 for the same period. China Nutrifruit Group Ltd (AMEX:CNGL) has the 8th highest Return on Assets in this segment of the market. Its ROA was 35.89% for the last 12 months. Its Asset Turnover ratio (revenue divided by assets) was 1.35 for the same period. SINA Corporation (USA) (NASDAQ:SINA) has the 9th highest Return on Assets in this segment of the market. Its ROA was 35.65% for the last 12 months. Its Asset Turnover ratio (revenue divided by assets) was 0.31 for the same period. Perfect World Co., Ltd. (ADR) (NASDAQ:PWRD) has the 10th highest Return on Assets in this segment of the market. Its ROA was 35.56% for the last 12 months. Its Asset Turnover ratio (revenue divided by assets) was 0.81 for the same period.
tdp2664
China Analyst
Top 10 U.S.-Listed Chinese Stocks with Highest Return on Assets: GPRC, HGSH, SCOK, CNET, CJJD, CYOU, BIDU, CNGL, SINA, PWRD (Oct 31, 2010)
Hot Stocks: Monster Worldwide Inc. and Newpark Resources Inc.
dow2664
Hot Stocks: Monster Worldwide Inc. and Newpark Resources Inc. Schaeffers Research – Oct 29, 2010 The Dow Jones Industrial Average (DJIA) has bounced back from early losses, though stocks have made little progress into positive territory as Wall Street digests the preliminary report on US …
Hot Stocks: Monster Worldwide Inc. and Newpark Resources Inc.
Consumer Good Stocks Closed Lower (Ford, GT, AVP)
Ford Motor Company (NYSE:F) slid 0.63% to $14.13. This week, the company said that its third-quarter net income jumped to $1.7 billion or 43 cents a share, from $997 million, or 29 cents a share, in the year-ago period. Revenue fell slightly to $29 billion from $30.3 billion. Wall Street analysts expected net income of 36 cents a share and revenue of $27.9 billion, according to a survey by FactSet Research. At Friday`s closing market price, the market capitalization of the company stands at $48.60 million. The Goodyear Tire & Rubber Company (NYSE:GT) dropped 3.22% to $10.22. The company reported a net loss of $20 million, or 8 cents per share, for the third quarter, compared with a net profit of $72 million, or 30 cents per share, a year earlier. Excluding one-time items that included debt refinancing, Goodyear reported earnings of 13 cents per share. Analysts on average expected Goodyear to report earnings of 10 cents per share on that basis, according to Thomson Reuters. The 52-week range of the stock is $9.10-$16.39. The stock went down more than 29% year-to-date. Avon Products, Inc. (NYSE:AVP) went down 1.81% at $30.45. Avon’s net income in the third quarter rose to $166.7 million, or 38 cents a share from $156.2 million, or 36 cents a share, a year earlier. Excluding one-time items, earnings were 41 cents a share, compared with the analysts’ average estimate of 47 cents, according to Thomson Reuters. Revenue was up 4 percent at $2.66 billion. Analysts on average forecast $2.69 billion. Over the past 52-week, the stock had traded within the range of $25-$36.39 and is down more than 4% year-to-date.
tdp2664
Newsworthy Stocks
Consumer Good Stocks Ended Higher (EK, PG, CSTR)
Eastman Kodak Company (NYSE:EK) added 2.67% to $4.70. This week, the company reported that its third-quarter net income climbed to $155. The company late Thursday posted third-quarter net income of $170 million, or $2.33 a share, up from $101 million, or $1.38 a share, in the year-earlier period. Analysts surveyed by FactSet Research had expected Eastman Chemical to earn $2.24 a share. For the fourth quarter, the company said it will earn between $1.40 and $1.50 a share. Analysts are looking for $1.41 a share. Over the past 52-week, the stock had traded within the range of $3.26-$9.08. At Friday`s closing market price, the market capitalization of the company stood at $1.26 billion. The Procter & Gamble Company (NYSE:PG) surged 0.60% to $63.57. The company said Wednesday its first-quarter earnings fell 7% to $3.08 billion, or $1.02 a share, from $3.3 billion, or $1.06 a share, in the year-ago period. Wall Street analysts expected the consumer products giant to earn $1 a share on revenue of $20.27 billion, according to a survey of analysts by FactSet Research. For its second quarter, Procter & Gamble expects earnings of $1.05 a share to $1.11 a share, with net sales growth of 3% to 5%. Wall Street analysts expect earnings of $1.11 a share. Over the past 52-week, the stock had traded within the range of $39.37-$64.58 and is up more than 3% year-to-date. Coinstar, Inc. (NASDAQ:CSTR) skyrocketed 24.47% to $57.58. The company said that it earned $19.5 million, or 60 cents a share in its third-quarter on revenue $380.2 million, way ahead of analysts' estimates of a profit of 50 cents on revenue of $381.2 million. The company also lilted its full year forecast to $2.14 and $2.20 a share on revenue of $1.460 billion and $1.485 billion, ahead of analyst forecast of $1.91 on revenue of $1.472 billion. Over the past one month of trading sessions, the stock went up more than 33%.
tdp2664
Newsworthy Stocks
Can You Trust Earnings Reports?
Throughout mankind's history, scales have been a symbol of equality. As much as commoners rely on scales to be treated fairly, "ueber commoners" try to escape the scales of justice and equality and want to be measured by different and better standards. In his Gettysburg Address, Abraham Lincoln exhorted his listeners to ensure the survival of a government of the people, by the people, for the people. It seems like survival of the fittest like forces have turned a government of, by and for the people into a government of, for and by special interest groups. Buffett: No More Robin Hood This week we read that even the Robin Hood of investors, creates his own rules. Warren Buffett — the only candidate to even remotely resemble a Robin Hood of Wall Street — had a friendly exchange with the SEC about the treatment of actual losses. Warren Buffett's Berkshire Hathaway (NYSE: BRK.A ) was sitting on $1.86 billion in losses caused by declining Kraft Foods (NYSE: KFT ) and US Bancorp (NYSE: USB ) stock. The losses were more than 12 months old and according to current accounting rules had to be written down. Perhaps Warren had seen how Wall Street is allowed to bend accounting rules to its favor (more about that in a moment) and thought: "What they can do I can do better." In short, Berkshire didn't write down the $1.86 billion in losses because … drum roll … as Berkshire's Chief Financial Officer Marc Hamburg's reasoned: "We believe it is reasonably possible that the market prices of Kraft Foods and U.S. Bancorp will recover to our cast within the next one to two years assuming that there are no material adverse events affecting these companies or the industries in which they operate." In other words, Berkshire didn't want to write down losses, because under the right circumstances there's a fair chance that stock prices will recover. Perfect Conditions — 100% Profitability Of course, under the right conditions any loss could reverse itself. But, because we don't live in a perfect world, we have accounting rules. The final numbers are designed to help investors evaluate a company's current financial health. If the doctor tells you that you have high cholesterol, do you tell him: "Don't worry, under the perfect conditions I'll eat only raw vegetables," when in reality you live on burgers and fries and should be on a double dose of cholesterol meds? Interestingly — and very smartly — Warren Buffett's new knight, Todd Combs, has stolen the headlight and absorbed the attention of what otherwise could turn into a full-fledged accounting scandal. Further Implications Courtesy of the post-2007 credit contraction, Wall Street Banksters (NYSE: XLF ), the administration, and reputable companies have become quite adept at the denial and cover-up approach. Case in point, Fannie and Freddie. In 2008, management for the ailing housing giant denied financial trouble. On Sunday, Sept. 7, 2008, the government seized control of Fannie and Freddie. Nevertheless, stocks rallied on Monday the morning after. Despite stock's (NYSE: VTI ) party mood, the ETF Profit Strategy Newsletter considered banks (NYSE: KBE ) and financial institutions (NYSE: XLF ) a "downward spiral with no stop-loss provision" and predicted Dow (DJI: DJI) 7,500 previously in September 2008. As stocks quickly tumbled to Dow 7,500, the government became desperate. Real estate-related losses were piling up; investors lost confidence in the financial system and drove Washington Mutual out of business. The problem was too big to fix, so the administration forced the Financial Accounting Standards Board to change Rule 157. Obviously, the fix is only topical. If it wasn't, why would Fannie and Freddie need an additional $215 billion in aid? The "new and improved" Rule 157 allowed Banksters to value assets at what they might be worth in the future. If bank A purchased a portfolio of real estate (NYSE: IYR ) for $10 million in 2006 and lost $6 million because the assets turned toxic, bank A is allowed to value the portfolio just below $10 million. The very real loss is not included in the current earnings numbers. Can You Trust Earnings? The real question is whether you can trust reported earnings? If Berkshire, along with most banks and financial conglomerates, has the legal right to fudge their earnings we may rightly wonder who else is employing this convenient accounting trick? Some would call them stupid if they didn't. Ironically, Citigroup's profits exceeded estimates because they reduced bad loan provisions. JPMorgan (NYSE: JPM), on the other hand, expects mortgage buybacks (related to the foreclosure disaster) to cost lenders $120 billion. To emphasize, to see Citigroup (NYSE: C ) reducing its bad loan reserves would be like an insurance company reducing its natural disaster fund right before hurricane season. Be that as it may, the S&P (SNP: GSPC ), Dow Jones (NYSE: DIA ), and Nasdaq (Nasdaq: IXIC ) continue to rally. The Nasdaq 100 (NASDAQ: QQQQ ) has already shot past its April 2010 recovery high, while the Dow and S&P (NYSE: IVV ) are within striking distance. Expect the Unexpected Following a horrendous August, investors were expecting a terrible September and/or October. The opposite happened. As we approach November, we hear that this month usually kicks off the most profitable time of the year. Fourth-quarter institutional cash inflows tend to result in the best consecutive three-month period. As we've discussed here in the past, institutions are not the only ones that provide liquidity right now. The Federal Reserve via its POMO purchases is another one (detailed analysis available in the November issue of the ETF Profit Strategy Newsletter ). This extra liquidity is not to be underestimated. An Extra Black Swan As we've experienced many times, the market tends to surprise the investing masses — most of which are bullish right now. A decline from current prices would certainly be a surprise. To the average investor, who's betting on QE2 to lift the economy and personal investments, a decline would indeed represent a "Black Swan." As noted in any chart, this season of the year, sentiment, and the market's behavior indicates that the next couple of weeks are likely to be pivotal for the upcoming months. As of yet, the market has not given away its true intentions, but it's sending subtle clues. Some recent support/resistance points are likely to turn into trigger levels, which once activated should fuel a move into that direction. The semi-weekly Technical Forecast (part of the ETF Profit Strategy Newsletter) includes the latest technical analysis along with trigger, target, safety and stop-loss levels designed to navigate the current environment profitably. This article is written by Simon Maierhofer of ETFguide.com. ETFguide is the information leader on exchange-traded funds because of its vendor-neutral approach and its progressive reporting style. Unique features include an ETF bookstore, a monthly e-mail newsletter and subscription-based ETF portfolios.
tdp2664
gol2664
InvestorPlace
Top 10 Focus Stocks of The Day: QCOR, GNMK, PWAV, EL, STMP, MXIM, STRA, SCR, CALD, VPRT (Oct 31, 2010)
Below are today's top 10 focus stocks. These momentum stocks are attracting a lot of interest from traders. One Chinese company (SCR) is on the list.
Questcor Pharmaceuticals, Inc. (NASDAQ:QCOR) is today's 1st best focus stock. Its daily price change was 12.4% in the previous trading day. Its upside potential is 14% based on brokerage analysts' average target price of $14 on the stock. It is rated positively by 100% of the 2 analyst(s) covering it. Its long-term annual earnings growth is 28% based on analysts' average estimate. GenMark Diagnostics, Inc (NASDAQ:GNMK) is today's 2nd best focus stock. Its daily price change was 11.4% in the previous trading day. Its upside potential is 63% based on brokerage analysts' average target price of $8 on the stock. It is rated positively by 100% of the 3 analyst(s) covering it. Its long-term annual earnings growth is 30% based on analysts' average estimate. Powerwave Technologies, Inc. (NASDAQ:PWAV) is today's 3rd best focus stock. Its daily price change was 11.0% in the previous trading day. Its upside potential is -2% based on brokerage analysts' average target price of $2 on the stock. It is rated positively by 22% of the 9 analyst(s) covering it. Its long-term annual earnings growth is 125% based on analysts' average estimate. The Estee Lauder Companies Inc. (NYSE:EL) is today's 4th best focus stock. Its daily price change was 10.5% in the previous trading day. Its upside potential is 0% based on brokerage analysts' average target price of $71 on the stock. It is rated positively by 42% of the 19 analyst(s) covering it. Its long-term annual earnings growth is 16% based on analysts' average estimate. Stamps.com Inc. (NASDAQ:STMP) is today's 5th best focus stock. Its daily price change was 10.5% in the previous trading day. Its upside potential is -4% based on brokerage analysts' average target price of $15 on the stock. It is rated positively by 67% of the 3 analyst(s) covering it. Its long-term annual earnings growth is 18% based on analysts' average estimate.
Maxim Integrated Products Inc. (NASDAQ:MXIM) is today's 6th best focus stock. Its daily price change was 10.2% in the previous trading day. Its upside potential is 0% based on brokerage analysts' average target price of $22 on the stock. It is rated positively by 38% of the 26 analyst(s) covering it. Its long-term annual earnings growth is 14% based on analysts' average estimate. Strayer Education, Inc. (NASDAQ:STRA) is today's 7th best focus stock. Its daily price change was 9.3% in the previous trading day. Its upside potential is 14% based on brokerage analysts' average target price of $160 on the stock. It is rated positively by 33% of the 18 analyst(s) covering it. Its long-term annual earnings growth is 16% based on analysts' average estimate. Simcere Pharmaceutical Group (NYSE:SCR) is today's 8th best focus stock. Its daily price change was 9.2% in the previous trading day. Its upside potential is -6% based on brokerage analysts' average target price of $9 on the stock. It is rated positively by 0% of the 6 analyst(s) covering it. Its long-term annual earnings growth is 16% based on analysts' average estimate. Callidus Software Inc. (NASDAQ:CALD) is today's 9th best focus stock. Its daily price change was 9.1% in the previous trading day. Its upside potential is 15% based on brokerage analysts' average target price of $6 on the stock. It is rated positively by 100% of the 3 analyst(s) covering it. Its long-term annual earnings growth is 10% based on analysts' average estimate. VistaPrint NV (NASDAQ:VPRT) is today's 10th best focus stock. Its daily price change was 8.6% in the previous trading day. Its upside potential is 16% based on brokerage analysts' average target price of $49 on the stock. It is rated positively by 50% of the 12 analyst(s) covering it. Its long-term annual earnings growth is 20% based on analysts' average estimate.
tdp2664
China Analyst
Top 10 Focus Stocks of The Day: QCOR, GNMK, PWAV, EL, STMP, MXIM, STRA, SCR, CALD, VPRT (Oct 31, 2010)
Weekly News Roundup: Safeway (NYSE:SWY)
Here’s a run-down of Safeway (NYSE:SWY) news briefs from last week. Safeway (NYSE:SWY) stocks ended the week at 22.9 (as of 10/29/2010). Weekly News Roundup: Safeway (NYSE:SWY) Tuesday 26 October Safeway (NYSE:SWY) quarterly figures are down slightly. Safeway (NYSE:SWY) quarter figures have been downgraded slightly in the third quarter of 2010 compared to the third quarter of 2009. The company's net income was $122.8 million for the third quarter of 2010 compared to $128.8 million for the third quarter of 2009. Safeway Inc. is one of the largest food and drug retailers in North America based on sales. The company operates 1,702 stores in the US and Canada. Steve Burd, chairman, president and CEO said that "Our third quarter results were in line with our expectations. The trend in price per item improved during the quarter. We expect this trend to continue." Friday 29 October Safeway Foundation has awarded $90,000 in grants to local charities. During this award, the foundation distributed approximately $90,000 in grants to 25 local charities, which is funded through the generous contributions of Safeway employees throughout its Eastern Division. The Foundation distributes more than $200,000 annually with special emphasis on organizations in the areas of hunger relief, education, health and human services and special needs. Gregory Ten Eyck, chairman of Safeway Foundation for the Eastern Division said that "The employees of Safeway are proud to be able to support local organizations like this that touch the lives of our customers." We will be monitoring the Safeway (NYSE:SWY) share price for developments over the next few weeks.
tdp2664
E money daily
Top Losers On News (PWER, NUVA, DRC)
Power-One, Inc. (NASDAQ:PWER) fell 6.38% to $10.42 on unusual volumes after the company said it earned 40 cents a share on an adjusted basis in its third-quarter on revenue of $314 million, ahead of analysts' estimates of a profit of 23 cents a share on revenue of $264.26 million. The company sees $340-$360 of revenue in its fourth quarter, compared to analysts estimates of $300 million. The stock went up more than 129% year-to-date. NuVasive, Inc. (NASDAQ:NUVA) slumped 28.53% to $26.17. For the third quarter, the company reported net income of $8.5 million, or 21 cents a share, compared with $5.06 million, or 13 cents a share a year ago. Revenue rose 27 percent to $120.3 million. Analysts on average expect earnings of $1.53 a share on revenue of $487.5 million, according to Thomson Reuters. The company cut its full-year earnings outlook to $1.42-$1.45 from $1.50-$1.60 and revenue view to $470-$475 million from $485-$495 million. The stock went down more than 18% year-to-date. At closing market price, the market capitalization of the company stands at $1.03 billion. Dresser-Rand Group Inc. (NYSE:DRC) lost 7.29% to $34.22. The company reported third-quarter net income of $37.5 million or $0.46 per share, compared to $74.6 million or $0.91 per share in the prior year quarter. Total revenues for the quarter were $483.1 million, down 21% from $612.1 million in the previous year period. Eight Wall Street analysts expected revenues of $509.39 million. On average, 13 analysts polled by Thomson Reuters expected the company to report earnings of $0.47 per share for the period. Analysts’ estimate typically exclude special items. Disclaimer: The assembled information distributed by epicstockpicks.com is for information purposes only, and is neither a solicitation to buy nor an offer to sell securities. Epicstockpicks.com does expect that investors will buy and sell securities based on information assembled and presented herein. EpicStockPicks.com will not be responsible in any way for or accept any liability for any losses arising from an investor's reliance on or use of information obtained from our website or emails. PLEASE always do your own due diligence, and consult your financial advisor.
tdp2664
Epic Stock Picks
Stocks Going Ex Dividend the Third Week of November
dow2664
Here is our latest update on the stock trading technique called ‘Buying Dividends’. This is the process of buying stocks before the ex dividend date and selling the stock shortly after the ex date at about the same price, yet still being entitled to the dividend . This technique generally works only in bull markets. In flat or choppy markets, your have to be extremely careful. In order to be entitled to the dividend, you have to buy the stock before the ex-dividend date, and you can’t sell the stock until after the ex date. The actual dividend may not be paid for another few weeks. WallStreetNewsNetwork.com has compiled a downloadable and sortable Excel list of the stocks going ex dividend during the next week or two. The list contains many dividend paying companies, all with market caps over $500 million, and yields over 2%. Here are a few examples showing the stock symbol, the ex-dividend date and the yield. Just in time for Halloween, The Hershey Company (HSY) market cap: $11.5B ex div date: 11/22/2010 yield: 2.5% Applied Materials, Inc. (AMAT) market cap: $15.9B ex div date: 11/22/2010 yield: 2.3% The additional ex-dividend stocks can be found at wsnn.com. (If you have been to the website before, and the latest link doesn’t show up, you may have to empty your cache.) If you like dividend stocks, you should check out the high yield utility stocks and the Monthly Dividend Stocks at WallStreetNewsNetwork.com or WSNN.com. Dividend definitions: Declaration date: the day that the company declares that there is going to be an upcoming dividend. Ex-dividend date: the day on which if you buy the stock, you would not be entitled to that particular dividend; or the first day on which a shareholder can sell the shares and still be entitled to the dividend. Record date : the day when you must be on the company’s books as a shareholder to receive the dividend. The ex-dividend date is normally set for stocks two business days before the record date. Payment date: the day on which the dividend payment is actually made, which can be as long at two months after the ex date. Don’t forget to reconfirm the ex-dividend date with the company before implementing this technique. Disclosure: Author does not own any of the above at the time article was written. By Stockerblog.com

Stocks Going Ex Dividend the Third Week of November
Wall Street little changed with stimulus in focus
dow2664
Wall Street little changed with stimulus in focus Business Day – Oct 29, 2010 The Dow Jones industrial average added 8,36 points, or 0,08%, to 11 122,31. The Standard & Poor's 500 Index edged up 0,87 points, or 0,07%, at 1 184,65. The Nasdaq Composite Index gained 6,98 … Industrials close with 4-point gain – Albany Times Union Stocks close up after strong month – Worcester Telegram istockAnalyst.com
Wall Street little changed with stimulus in focus
Halloween Sales Increase on Last Minute Treats, Gifts, Costumes, Party Ideas; Halloween Holiday Success
dow2664
Happy Halloween to everyone, especially the local retailers. Halloween is sparking retail sales right now as nationwide retailers report an increase in Halloween sales this year compared to the same time last year. October was a great month for the market overall and the United States economy continues to slowly recover. An increase in sales approaching the Halloween holiday is a good sign for the upcoming months that include Thanksgiving and Christmas. Christmas is the number one sales holiday for retailers and Halloween often comes in second place. The positive numbers stemming from the Halloween sales are thought to be valid indicators that point to a lucrative holiday shopping season. The National Retail Federation predicts more than a 22% increase in sales this year for Halloween compared to last year. Spending on the part of consumers has increased and people are breaking away from the recessive tendencies and behaviors of saving instead of spending. Halloween sales from candy, decorations, gifts and costumes have played a part in increasing the earnings reports for many retailers. The analysis of sales predicts that the average consumer will spend just over $60 on costumes, candy, cards and decorations. Even pet owners are expected to get into the action as they will purchase costumes to for their pets. Internet sales for Halloween are expected to increase as well. People are starting to feel more comfortable with spending again and retailers are reporting that in general, seasonal sales are up. It has helped this year that Halloween falls on a Sunday which gives consumers an entire weekend to get into gear and buy all the relevant accessories needed to make their Halloween experience a success. Up next, increased consumer spending for November and December. Author: Genny Germano
Saturday, October 30, 2010
Randgold Resources announces Total Voting Rights
gol2664
Randgold Resources announces Total Voting Rights MarketWatch – Oct 29, 2010 JERSEY, CHANNEL ISLANDS, Oct 29, 2010 (MARKETWIRE via COMTEX) — RANDGOLD RESOURCES LIMITED Incorporated in Jersey, Channel Islands Reg. No. 62686 LSE Trading Symbol: RRS Nasdaq Trading Symbol … Randgold Resources Limited — Total Voting Rights – Marketwire
TODAY’S STOCK MARKET DOW JONES INDUSTRIAL AVERAGE DJI, NYSE, S&P 500, NASDAQ INDEX TRENDS, NOTES October 29th, 2010 Close
dow2664
The Commerce Department reported earlier today that the economy expanded at a 2% annual rate in the July through September quarter. Many were hoping for more as the rate of growth during the April through June period was also below average at 1.7% growth. Consumers held up their end of the bargain a bit better by helping increase spending growth values. These posted values show a 2.6% growth in spending, up from the 2.2% growth value posted in the second quarter. This represents a continuation of the slow economic recovery trends. Progress has been slow and recovery stimulation continues to be debated. Federal aid is needed to strengthen the economy as planning and method of intervention implementation becomes more controversial as we approach the mid term elections. It is anticipated that the Federal Reserve will launch a plan to purchase government bonds in an attempt to make loans cheaper and prompt lending, spending and economic growth. Overall today, uncertainty outweighed all else and stocks showed little movement as investors sidelined themselves ahead of next week’s Federal Reserve meeting. The Dow Jones Industrial Average finished in the green by .04% and finished at 11,118.49. The NYSE ended the day in the green as well and settled at 7,514. The Nasdaq finished in the green at 2,507.41. The S&P 500 fell into the red by .04% and settled at 1,183.26. The dollar gained on the euro by .0009 and the ten year treasury yield was 2.61%. Author: Frank Matto
Maxim Integrated Products (MXIM) Soars To New Highs
Maxim Integrated Products Inc. (NASDAQ:MXIM) shares rose 11.82% on Friday following the company's reporting of record revenue of $626.1 million beating the analysts' estimates of $604 million for the first quarter of fiscal year 2011 on Thursday. The shares of the company were trading at $21.91 after market closed and 14.66 million shares exchanged hands. Based on GAAP, diluted earnings per share in the September quarter was $0.39. The results were reduced by $17.9 million of special expense items which primarily consist of pre-tax expense for acquisition related items. GAAP earnings per share excluding special expense items was $0.43, while the analysts had expect3ed the Company to report an eps of $0.35. The Company reported net revenue of $626.1 million for its fiscal 2011 first quarter, an 11% increase over the $566.0 million revenue recorded in the prior quarter. Gross margin was 61.7% on GAAP basis and 63.4% on non-GAAP basis. MXIM provides a fiscal second quarter revenue outlook: $595 to $625 million and earnings per share: $0.36 to $0.41 GAAP ($0.39 to $0.44 excluding special expense items). Maxim Integrated Products is a publicly traded company that designs, manufactures, and sells high-performance semiconductor products. To date, it has developed over 6,400 products serving the industrial, communications, consumer, and computing markets.
tdp2664
Newsworthy Stocks
Why Buy Gold for Inflation Defense?
Wheat and cotton are rising in price. But they’re an impractical inflation hedge…
AS ALWAYS seems the case, there is a big different between what the government statistics are reporting and what’s going on in the real world, writes Jake Weber, editor of The Casey Report.
According to the most recent inflation reading published by the Bureau of Labor Statistics (BLS), consumer prices grew at an annual rate of just 1.1% in August.
The government has an incentive to distort CPI numbers, for reasons such as keeping the cost-of-living adjustment for Social Security payments low. While there’s no question that you may be able to get a good deal on a new car or a flat-screen TV today, how often are you really buying these things? When you look at the real costs of everyday life, prices have risen sharply over the last year. For simplicity’s sake, consider the cash market prices on some basic commodities.
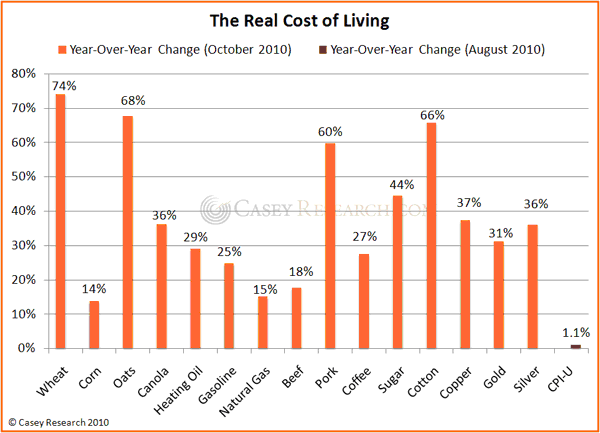
On average, our basic food costs have increased by an incredible 48% over the last year (measured by wheat, corn, oats, and canola prices). From the price at the pump to heating your stove, energy costs are up 23% on average (heating oil, gasoline, natural gas). A little protein at dinner is now 39% higher (beef and pork), and your morning cup of coffee with a little sugar has risen by 36% since last October.
You probably aren’t buying new linens or shopping for copper piping at the hardware store every day, but I included these items to show the inflationary pressures on some other basic materials that will likely affect consumer prices down the road.
The jump in gold and Silver Prices illustrates that it’s not just supply and demand issues driving the precious metals higher – the decline in purchasing power of the Dollar is also showing up in the price of physical goods. It is because stashing wheat and cotton in the garage is an impractical way to protect purchasing power that investors are increasingly looking to protect themselves with the monetary metals – a trend that is now very much in motion.
Buy Gold and physical Silver Bullion at the best prices possible by using the award-winning, mining-industry backed world No.1 online, BullionVault…
gol2664
Dow Jones Indexes and UBS Announce 2011 Weights of Dow Jones-UBS Commodity Index
dow2664
Dow Jones Indexes and UBS Announce 2011 Weights of Dow Jones-UBS Commodity Index Benzinga – Oct 29, 2010 NEW YORK, Oct. 29, 2010 (GLOBE NEWSWIRE) — Dow Jones Indexes, a leading global index provider, and UBS Investment Bank announced the new target weightings for the Dow Jones-UBS Commodity Index SM …
Dow Jones Indexes and UBS Announce 2011 Weights of Dow Jones-UBS Commodity Index
Market News: Archer Daniels Midland (NYSE:ADM), Boeing Co. (NYSE:BA), Dupont (NYSE:DD)
Here are several more stock briefings which could affect stocks in trading later today. The following listed companies should see some movement: Archer Daniels Midland (NYSE:ADM), Boeing Co. (NYSE:BA), Dupont (NYSE:DD). Here is a more detailed look at the news that will affect each company when trading continues. Archer Daniels Midland (NYSE:ADM) Archer Daniels Midland (NYSE:ADM) is looking to consolidate and strengthen its executive lineup, with a number of changes. Ray Young will join as the Chief Financial Officer, who previously was working in General Motors Corporation. Steven Mills will be named as the senior executive vice president of performance and growth. John Rice, who led the company's commercial and production teams, will now handle the role of vice chairman and will be focusing on maximizing existing assets. Patricia Woertz, the CEO of Archer Daniels Midland (NYSE:ADM) said in a release that the announcements were part of the company’s initiative to grow shareholder value, earnings and the size of the company. Boeing Co. (NYSE:BA) Boeing (NYSE:BA) had some good news recently, with the finalization of a deal with Russian authorities on 737 airliners. The agreement also includes the purchase rights for an additional 35 Next -Generation 737s Marlin Dailey, vice president of Sales, Boeing (NYSE:BA) Commercial Airplanes said that "This is a great day in the history of our long and enduring partnership with Rostechnology. Today’s order for 737-700s, 737-800s and 737-900ERs underscores Rostechnology’s confidence in the world’s most successful single-aisle airplane. The entire Next-Generation 737 family offers superior operating economics and the 737-900ER has the best seat mile cost of any single-aisle airplane and provides our Next-Generation 737 customers with a compelling low-risk growth opportunity." Dupont (NYSE:DD) Two solar grades have been introduced by DuPont (NYSE:DD), in relation to its PET products. Both grades combine high stiffness with low warpage and have been specifically developed for long-term outdoor applications. DuPont (NYSE:DD) said that UV-resistant DuPont Rynite PET resins are designed for cost-effective manufacturing of photovoltaic module frames and components. According to DuPont (NYSE:DD), when used in photovoltaic applications, polymers can help increase design flexibility for assembly and installation. It can also provide an opportunity for functional integration. We could see more movement when trading continues for Archer Daniels Midland (NYSE:ADM), Boeing Co. (NYSE:BA) and Dupont (NYSE:DD).
tdp2664
E money daily
Top 10 Industrial Stocks with Highest Return on Assets: CVVT, NFEC, RAVN, CWS, GGG, DNEX, FAST, OFLX, MMM, STRN (Oct 30, 2010)
Below are the top 10 Industrial stocks with highest Return on Assets ratio (ROA) for the last 12 months, UPDATED TODAY before 4:30 AM ET. ROA shows a company's efficiency in making profits from its assets. It is equal to net profits divided by total assets. Two Chinese companies (CVVT, CWS) are on the list.
China Valves Technology, Inc. (NASDAQ:CVVT) has the 1st highest Return on Assets in this segment of the market. Its ROA was 25.18% for the last 12 months. Its Asset Turnover ratio (revenue divided by assets) was 0.79 for the same period. NF Energy Saving Corp (NASDAQ:NFEC) has the 2nd highest Return on Assets in this segment of the market. Its ROA was 21.19% for the last 12 months. Its Asset Turnover ratio (revenue divided by assets) was 0.92 for the same period. Raven Industries, Inc. (NASDAQ:RAVN) has the 3rd highest Return on Assets in this segment of the market. Its ROA was 19.91% for the last 12 months. Its Asset Turnover ratio (revenue divided by assets) was 1.58 for the same period. China Wind Systems, Inc. (NASDAQ:CWS) has the 4th highest Return on Assets in this segment of the market. Its ROA was 19.79% for the last 12 months. Its Asset Turnover ratio (revenue divided by assets) was 1.32 for the same period. Graco Inc. (NYSE:GGG) has the 5th highest Return on Assets in this segment of the market. Its ROA was 18.17% for the last 12 months. Its Asset Turnover ratio (revenue divided by assets) was 1.35 for the same period.
Dionex Corporation (NASDAQ:DNEX) has the 6th highest Return on Assets in this segment of the market. Its ROA was 17.46% for the last 12 months. Its Asset Turnover ratio (revenue divided by assets) was 1.21 for the same period. Fastenal Company (NASDAQ:FAST) has the 7th highest Return on Assets in this segment of the market. Its ROA was 17.44% for the last 12 months. Its Asset Turnover ratio (revenue divided by assets) was 1.55 for the same period. Omega Flex, Inc. (NASDAQ:OFLX) has the 8th highest Return on Assets in this segment of the market. Its ROA was 15.45% for the last 12 months. Its Asset Turnover ratio (revenue divided by assets) was 1.41 for the same period. 3M Company (NYSE:MMM) has the 9th highest Return on Assets in this segment of the market. Its ROA was 14.46% for the last 12 months. Its Asset Turnover ratio (revenue divided by assets) was 0.90 for the same period. Sutron Corporation (NASDAQ:STRN) has the 10th highest Return on Assets in this segment of the market. Its ROA was 14.36% for the last 12 months. Its Asset Turnover ratio (revenue divided by assets) was 1.24 for the same period.
tdp2664
China Analyst
Top 10 Industrial Stocks with Highest Return on Assets: CVVT, NFEC, RAVN, CWS, GGG, DNEX, FAST, OFLX, MMM, STRN (Oct 30, 2010)
Monster Worldwide Inc. (MWW) Finishes Higher after Q3 Results
Monster Worldwide Inc. (NYSE: MWW) shares rallied in today's trading after the company reported its third-quarter financial results. Shares ended the day 25.50% higher at $18.06 on above average volume of 20.98 million. The stock touched a 52-week high of $19.10. The stock has a 52-week range of $10.01-$19.10. Yesterday, the company announced third quarter fiscal 2010 results, with revenues at $229.0 million, an increase of 7% as compared to previous year. The revenues showed the growth due to increased bookings of 26% to $235.0 million, or 23% excluding HotJobs, and a sequential improvement in deferred revenue. The net loss was $5.7 million, or $0.05 per share, as compared to net income of $33 million, or $0.27 per share, in the third quarter of 2009, which included a favorable tax adjustment of $31.0 million, or $0.26 per share. The company expects the revenue in range of $258.0 – $272.0 for fourth quarter 2010 and $919.0 -$933.0 for full year 2010. The bookings are expected in range of $328.0 – $342.0 for fourth quarter 2010 and $990.0 – $1,004.0 for full year 2010. Monster provides a global online employment solution. Disclaimer: The assembled information distributed by epicstockpicks.com is for information purposes only, and is neither a solicitation to buy nor an offer to sell securities. Epicstockpicks.com does expect that investors will buy and sell securities based on information assembled and presented herein. EpicStockPicks.com will not be responsible in any way for or accept any liability for any losses arising from an investor's reliance on or use of information obtained from our website or emails. PLEASE always do your own due diligence, and consult your financial advisor.
tdp2664
Epic Stock Picks
6 Stocks With Dividend Increases This Week
Last week's list of stocks increasing dividends was little light, but some big names have come out of the woodwork in dividend stock news recently. Gold miner GoldCorp Inc. (NYSE: GG ) doubled its dividend, food products blue chip Sara Lee (NYSE: SLE ) added to its already plump yield and some important small-cap tech stocks got in on the action, too. Here's this week's roundup of the latest dividend increases and high-yield dividend stocks: Sara Lee Dividend Increase On Thursday, food-products giant Sara Lee (NYSE: SLE ) declared a quarterly dividend of 11.5 cents per share, an increase of about 5% over its prior dividend of 11 cents per share. The bump now gives Sara Lee a yield of about 3.2%. Sara Lee is currently interviewing executives for its top spot, but that open position hasn't held back shares. The blue-chip stock is up about 20% year to date, compared with just about 7% for the S&P 500 index. The stock rallied this fall on rumors of a buyout, but talks with Apollo Global Management have reportedly fallen through. GoldCorp Dividend Increase GoldCorp Inc. (NYSE: GG ) reported earnings this week that were quadruple last year's numbers. No surprise, given how gold prices have been on a tear. And investors have even more to be happy about as the gold-mining stock reported a dramatic doubling of its dividend yield. -GoldCorp increased its quarterly dividend from 4.5 cents a share to 9 cents a share. That gives the gold company a dividend yield of 0.8%. Since GG just paid a dividend on Oct. 22, it will be another three months until this higher yield turns up in payouts. GoldCorp stock is up about 13% year-to-date, double the S&P 500 index in 2010. Perrigo Dividend Increase Health-care mid cap Perrigo Co. (NASDAQ: PRGO ) isn't quite a dividend heavyweight, but it's worth noting the company’s 12% increase in its quarterly payday from 6.25 cents to 7 cents a share. That gives the stock a new yield of about 0.7%. The dividend is payable Dec. 14 to shareholders of record Nov. 26. Perrigo has had a breakout 2010, with gains of about 68% so far this year. The company will announce third-quarter earnings Nov. 2 and is expected to see 15% to 20% EPS growth. Evercore Dividend Increase Evercore Partners (NYSE: EVR ), an independent investment banking advisory firm, has cashed in big time as cash-rich companies have been on a spree of mergers and acquisitions. Evercore had a 48% jump in third-quarter revenue, and a significant 20% bump to its dividend from 15 cents a share to 18 cents. EVR has also authorized a 2 million-share buyback program. Evercore now has a dividend yield of about 2.3%. The small-cap company has struggled in 2010, posting a loss year to date despite a gain for the broader markets. However, since July 1 Evercore is up about 30% and its recent strong earnings report may signal better times ahead. AEP Dividend Increase Utility stock American Electric Power (NYSE: AEP ) has signed off on a 9.5% quarterly dividend increase, from 42 cents to 46 cents a share. That gives AEP stock a dividend yield just shy of 5%. The next payout from the Ohio utility stock will be Dec. 10 to shareholders of record Nov. 10. The American Electric Power board formalized the dividend increase this week, after previous hints it would do so. Rumblings of an increase emerged after a strong third-quarter report earlier in October that included a 25% jump in earnings. Shares of AEP stock are up about 15% since July 1. DDi Dividend Increase Circuit board small cap DDi Corp. (NASDAQ: DDIC ) may be modest in size, but its dividend yield is now one of the best in the tech sector. After strong third-quarter earnings, DDi boosted its dividend from 6 cents a share to 10 cents a share, a 66% increase. DDIC stock now has a dividend yield of just over 4%. DDi also had some good earnings news Thursday. DDIC saw net sales jump 27% over last year, while income increased by about 8%. DDi shares have doubled so far in 2010, and it appears that the big profits are far from over if it is confidence enough for big payout increase. In other dividend stock news: Moody’s (NYSE: MCO ) maintained its quarterly dividend of 10.5 cents per share and dividend yield of 1.6%. Thomson Reuters (NYSE: TRI ) maintained its quarterly dividend of 29 cents per share and its dividend yield of 3.0%. Willis Group Holdings (NYSE: WSH ) maintained its quarterly dividend of 26 cents per share and dividend yield of 3.2%. DPL Inc. (NYSE: DPL ) maintained its quarterly dividend of 30.25 cents per share and dividend yield of 4.5%. Jeff Reeves is editor of InvestorPlace.com. As of this writing, he did not own a position in any of the stocks named here. Follow him on Twitter at http://twitter.com/JeffReevesIP .
tdp2664
gol2664
InvestorPlace
Market News: Delta Air Lines (NYSE:DAL), Johnson & Johnson (NYSE:JNJ), Intel Corp. (NASDAQ:INTC)
Here are some more breaking stock news briefs which could see some changes on the markets later. The following companies should see some movement: Delta Air Lines (NYSE:DAL), Johnson & Johnson (NYSE:JNJ), Intel Corp. (NASDAQ:INTC). Here is a more detailed look at the news that will affect each company when trading continues. Delta Air Lines (NYSE:DAL) Delta Air Lines (NYSE:DAL) has made a number of performance changes to its schedules, including discontinuing its service to Hilton Head Island Airport. Delta Air Lines (NYSE:DAL) already conducted a similar suspension last year. Delta Air Lines (NYSE:DAL) is also suspending its service to Florence and two other locations outside South Carolina. Joe Esposito, the managing director of Delta Air Line's (NYSE:DAL) network planning said, "Flights have experienced a significant decline in revenues and passenger loads this year. That, combined with decisions to phase out aging aircraft Delta flies in and out of Hilton Head prompted the decision. Although Delta would prefer to continue serving the market, we have made the difficult decision to eliminate our Hilton Head Airport service as part of our efforts to retire less-efficient turboprop and small jet aircraft from the Delta Connection fleet." Johnson & Johnson (NYSE:JNJ) A new investigation into a factory will be launched by Johnson & Johnson (NYSE:JNJ) in South Korea. Johnson & Johnson (NYSE:JNJ) have said that they will look into all possible contamination issues of a South Korean drug facility owned by a company which they are acquiring. At the beginning of this month, Johnson & Johnson (NYSE:JNJ) had announced the purchase of Crucell for about $2.41 billion, which will allow the company to gain a foothold in the coveted vaccine business. Crucell is a major vaccine supplier to UNICEF and developing countries. It also develops medicines that use antibodies to zero in on organisms causing infectious diseases. Intel Corp. (NASDAQ:INTC) A new factory in Vietnam is the latest step by Intel (NASDAQ:INTC) into the East. It is Vietnam’s first semiconductor factory, which produces chipsets for mobile devices and laptops. The company first had plans to construct the plant in China, but several reasons made it shift to Vietnam. Some called the move 'courageous', as the decision to build the plant was in 2006, in a country without a single world-class university – ahead of countries like India and China. The plant will help provide job for around 85,000 employees. Intel’s former country manager in Vietnam said that “Vietnam has the potential to be a small China in tech manufacturing.” We may see more movement when trading continues for Delta Air Lines (NYSE:DAL), Johnson & Johnson (NYSE:JNJ) and Intel Corp. (NASDAQ:INTC).
tdp2664
E money daily
Top 10 U.S.-Listed Chinese Stocks of the Week: PSOF, GRRF, FFHL, KUTV, CADC, GPRC, PWRD, JKS, IDI, NPD (Oct 30, 2010)
Below are the top 10 best-performing U.S.-listed Chinese stocks for the past week.
Pansoft Company Limited (NASDAQ:PSOF) is the 1st best-performing stock last week in this segment of the market. It was up 41.11% for the past week. Its price percentage change is -2.31% year-to-date. China GrenTech Corporation Limited (ADR) (NASDAQ:GRRF) is the 2nd best-performing stock last week in this segment of the market. It was up 29.86% for the past week. Its price percentage change is -18.70% year-to-date. Fuwei Films (Holdings) Co., Ltd (NASDAQ:FFHL) is the 3rd best-performing stock last week in this segment of the market. It was up 22.63% for the past week. Its price percentage change is 37.70% year-to-date. Ku6 Media Co., Ltd. (ADR) (NASDAQ:KUTV) is the 4th best-performing stock last week in this segment of the market. It was up 19.10% for the past week. Its price percentage change is 37.04% year-to-date. China Advanced Con. Materials Gr. Inc (NASDAQ:CADC) is the 5th best-performing stock last week in this segment of the market. It was up 19.05% for the past week. Its price percentage change is -4.62% year-to-date.
Guanwei Recycling Corp. (NASDAQ:GPRC) is the 6th best-performing stock last week in this segment of the market. It was up 15.88% for the past week. Its price percentage change is 25.08% year-to-date. Perfect World Co., Ltd. (ADR) (NASDAQ:PWRD) is the 7th best-performing stock last week in this segment of the market. It was up 15.67% for the past week. Its price percentage change is -17.85% year-to-date. JinkoSolar Holding Co., Ltd. (NYSE:JKS) is the 8th best-performing stock last week in this segment of the market. It was up 15.56% for the past week. Its price percentage change is N/A year-to-date. SearchMedia Holdings Limited (AMEX:IDI) is the 9th best-performing stock last week in this segment of the market. It was up 15.27% for the past week. Its price percentage change is -64.70% year-to-date. China Nepstar Chain Drugstore Ltd. (NYSE:NPD) is the 10th best-performing stock last week in this segment of the market. It was up 13.62% for the past week. Its price percentage change is -33.61% year-to-date.
tdp2664
China Analyst
Top 10 U.S.-Listed Chinese Stocks of the Week: PSOF, GRRF, FFHL, KUTV, CADC, GPRC, PWRD, JKS, IDI, NPD (Oct 30, 2010)
Gold and 12 Zeroes, Part I
Paul Volcker wrung inflation out of the system. Ben Bernanke is wringing cash-savers’ necks…
AS WE NEVER TIRE of boring anyone who’ll listen here at BullionVault, it’s not inflation alone that makes Gold Prices rise, writes head of research Adrian Ash.
If it were, the last decade’s four-fold rise would be missing, and gold wouldn’t have dropped by three-quarters during the 1980s and ’90s.
Sure, the cost of living has increased since 2001 – no doubt about that. And yes, the real value of money has contracted as global money supplies have surged. But the pace of change doesn’t compare with the 25% suffered by UK consumers in 1978, nor the 8% annual average hitting US consumers between 1971 and the end of 1980.
So the common link between the 1970s and the last decade of rising Gold Prices is a little more complex than inflation alone. But only a little.
Because it’s the failure of interest rates to keep pace with inflation that matters.
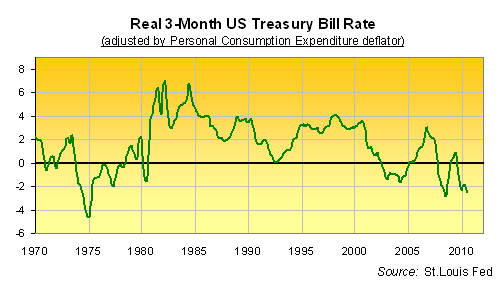
Check this…
- The 1970s saw 3-month Treasury bills pay an average of 0.1% per year less than domestic US inflation. That decade saw gold prices rise 24 times over vs. the Dollar;
- The 1980s and ’90s then saw 3-month bill rates average 3.1% more than inflation each year. Gold Prices fell by 81%;
- The last 11 years have since seen real T-bill rates sink alongside Federal Reserve rate and longer-term Treasury bond yields, averaging just 0.3% since Jan. 2000. Gold has risen 450% low-to-peak.
- Most recently – and thanks as much to the flight-to-safety after Lehmans collapsed as to Ben Bernanke’s response – real rates have now averaged fully 1.0% below US inflation since the global financial crisis began in summer ’07. Professional wholesale dealers meantime ask 1,350 US Dollars for an ounce of gold, up from $649 before the crisis broke.
A caveat: You shouldn’t try trading in and out of Gold Bullion using this indicator. That plunge in real rates on the chart above, for instance, of early 1980 proved a feint, as investors soon discovered after piling back into gold when it bounced from a 40% plunge. Similarly, the rise in real rates of 2006 didn’t make for a sell signal. The underlying trend, it turned out, was still down for rates…and up for gold. And short term, plenty of other factors can get in the way as well – be it mid-term US elections, the Indian festival season, or a global guessing-game of whether the Fed will print eleven or twelve zeroes after the figure $1 when it meets next week.
That policy, remember, is designed to mimic an interest-rate cut. Because interest rates already have already been slashed to zero, known as the “lower bound” amongst policy wonks, who now feel they need to somehow overcome the “zero bound” by printing money to help devalue it faster. Goldman Sachs reckons that, creating $4 trillion next Wednesday, would be “equivalent to a cut in interest rates of 3%”. Even so, the investment bank’s analysts complain that we’ll probably get a measly $2 trillion instead.
So, let’s take the vampire squid at its word, and imagine that the Fed goes for a two and twelve zeroes – whether immediately, or dripped out of Washington over a period of months. On Goldman’s maths, that would eat a further 1.5% off the real rate of interest (not) being paid by 3-month T-bills…and so such a move (and notional outcome) would take real returns down to minus 3.9%.
For US savers, that would be the worst level of real returns to cash since the start of 1975, back when US inflation was running above 10%. That same month, almost 36 years ago, the Gold Price hit what proved an intermediate peak, slipping by almost one-half as real interest rates then climbed up towards zero. (Like we said, real rates aren’t a dead-set signal for short-term direction.)
Real returns paid to cash then failed at zero, however, and slipped back – while gold rose 8-fold again – before the Volcker Fed finally set about “wringing inflation out of the system” in mid-1980 with double-digit overnight rates.
If you expect Ben Bernanke to wring anything but cash-savers’ necks in the next year, then please – go ahead and sell Gold Bullion. And if you want to know what happens if inflation subsides, as he keeps claiming it will, watch out for Part II next week.
Get the safest gold at the lowest prices by using BullionVault today…
gol2664
Nana Sangmuah: African Takeouts on the Menu
gol2664
Nana Sangmuah: African Takeouts on the Menu NASDAQ – Oct 29, 2010 Clarus Securities Analyst Nana Sangmuah was born in Ghana, West Africa-a growing hot spot for gold exploration. He believes several gold juniors operating in West Africa are prime takeover targets …
Apple (AAPL) Now No. 4 Mobile Phone Vendor
Here is your daily Apple (NASDAQ: AAPL ) stock news and rumors for Oct. 29, 2010. Good news for Apple shareholders today as the IDC reports that Apple has become the No. 4 mobile phone — not just smartphone — manufacturer in the world, bumping Research in Motion down to No. 5 and knocking Sony Ericsson down to No. 6. Meanwhile, Steve Jobs’ company continues to ramp up its presence in among enterprise customers as distributor Ingram Micro begins offering the iPad. And speaking of its financial successes, Apple has finally surpassed Microsoft in quarterly revenue. Apple Becomes No. 4 Mobile Phone Vendor, Surpasses Research in Motion: Apple has broken into the top five list of global mobile-phone vendors for the very first time, according to new results from the IDC Worldwide Quarterly Mobile Phone Tracker reported by BusinessWire. The category is all mobile phones, not just smartphones or connected devices. In the third quarter of 2010, Apple finally surged ahead of BlackBerry manufacturer Research in Motion (NASDAQ: RIMM ) and displaced Sony Ericsson (NYSE: SNE , NASDAQ: ERIC) from the top five. Apple still trails Nokia (NYSE: NOK ), Samsung and LG Electronics. IDC senior research analyst Kevin Restivo stressed that Apple’s 90.5% increase in year-on-year sales in the third quarter of 2010 demonstrated the increased importance of smartphones in the global mobile phone market. While Apple beat Research in Motion, RIMM also saw impressive growth, with a 45.9% year-on-year jump in sales during the same period. Some 340.5 million mobile phones were shipped between July and September 2010 compared with 297.1 million in the year prior. iPad Sales Grow in Enterprise Markets Says Distributor: Apple distributor Ingram Micro (NYSE: IM ) told Reuters this week that Apple has given the company the OK to begin selling the iPad to businesses as enterprise markets show increasing interest in the popular tablet computer. Ingram Micro CEO Greg Spierkl said that Apple itself has been surprised by the opportunity for business to business sales of the iPad considering that the device was targeted predominantly at consumers when it launched earlier this year. Since Apple announced quarterly earnings, Apple executives have emphasized the iPad’s success with enterprise buyers. Apple claimed that more than 65% of the Fortune 100, including companies like General Electric (NYSE: GE ) subsidiary NBC Universal and Hyatt Hotels (NYSE: H ), have begun using the iPad in daily operations. Apple also announced a new partnership with Unisys (NYSE: UIS ) to provide service to enterprise clients. If iPad sales continue to grow as predicted, hitting more than 14 million units sold by the end of the calendar year, it’s possible that Apple will take a dominant position in the business sector before competitors like Hewlett-Packard (NASDAQ: HPQ ) can even get their tablets to market. Microsoft Falls Behind Apple in Third-Quarter Revenues: Last summer, Apple was declared the most valuable technology company — largest by market capitalization – on the planet, finally surpassing Microsoft (NASDAQ: MSFT ) after a decade of growth thanks to its line of successful portable computing devices like the MacBook, iPod, iPhone, and most recently, the iPad. Apple did not, however, pull in more revenue than Microsoft in the April-through-June quarter. The same can’t be said of the July-to-September period, though, as Apple’s revenue finally surged ahead of Microsoft’s. Reporting $20.34 billion in revenue, Apple trounced Microsoft, which pulled in just $16.20 billion during the third quarter of 2010. Not only did Apple beat Microsoft but it also outdid Microsoft’s best-ever quarterly performance of $19 billion. As of this writing, Anthony Agnello did not own a position in any of the stocks named here.
tdp2664
gol2664
InvestorPlace
Nasdaq 3 Most Active Stocks (MU, PWER, VVUS)
Micron Technology Inc. (NASDAQ: MU) shares traded higher today. The stock ended the day 3.97% higher at $8.26, on above average volume of 86.40 million. The stock touched an intra-day high of $8.27. The stock has a 52-week range of $6.12-$11.40. Power-One Inc. (NASDAQ: PWER) shares fell after the company reported its third-quarter financial results. The stock ended the day 6.38% lower at $10.42, on above average volume of 38.57 million. The stock touched an intra-day low of $10.20. The stock has a 52-week range of $2.52-$13.04. Yesterday, the company announced its results for third quarter fiscal 2010, with revenues of $314.0 million, an increase of 214% from the third quarter 2009. VIVUS Inc. (NASDAQ: VVUS) shares saw a big jump in today's trading. The stock ended the day 26.43% higher, on above average volume of 27.23 million. The stock touched an intra-day high of $8.39. The stock has a 52-week range of $4.69-$13.68. Yesterday, the company announced the receipt of Complete Response Letter (CRL) from the U.S. Food and Drug Administration (FDA) regarding its new drug application (NDA) for the investigational new drug QNEXA (phentermine/topiramate) controlled-release capsules. Disclaimer: The assembled information distributed by epicstockpicks.com is for information purposes only, and is neither a solicitation to buy nor an offer to sell securities. Epicstockpicks.com does expect that investors will buy and sell securities based on information assembled and presented herein. EpicStockPicks.com will not be responsible in any way for or accept any liability for any losses arising from an investor's reliance on or use of information obtained from our website or emails. PLEASE always do your own due diligence, and consult your financial advisor.
tdp2664
Epic Stock Picks
VIVUS, Inc. (VVUS) Shares Jump 26%
VIVUS, Inc. (NASDAQ:VVUS) shares jumped 26.43% to $7.75 on Friday after the company announced that it received a Complete Response Letter (CRL) from the U.S. Food and Drug Administration (FDA) regarding its New Drug Application (NDA) for the investigational new drug QNEXA® (phentermine/topiramate) Controlled-Release Capsules. The FDA decided that the NDA cannot be approved in its present form. The application seeks the approval to market QNEXA as an oral, once-a-day formulation for the treatment of obesity, including weight loss and maintenance of weight loss, in patients who are obese or overweight with co-morbidities such as hypertension, type 2 diabetes, dyslipidemia or central adiposity. FDA requested a comprehensive assessment of topiramate’s and phentermine/topiramate’s teratogenic potential asking asked VIVUS to provide evidence that the elevation in heart rate associated with phentermine/topiramate does not increase the risk for major adverse cardiovascular events. The FDA requested that VIVUS formally submit the results from the already completed SEQUEL study (OB-305), a 52-week extension study for a subset of 675 patients who completed the previously reported 56-week CONQUER study. Top-line results from the two-year SEQUEL study were announced by VIVUS on September 21, 2010 and a final study report is being prepared for submission to the NDA. Finally, the FDA stated that if approved, phentermine/topiramate would be a Schedule IV drug due to the phentermine component. Leland Wilson, chief executive officer of VIVUS stated that the company remains confident in the efficacy and safety profile of QNEXA demonstrated in the clinical development program and looks forward to continue working with the FDA towards the approval for the treatment of obesity. VIVUS is a biopharmaceutical company developing therapies to address obesity, sleep apnea, diabetes and male sexual health. The company’s lead product in clinical development is QNEXA®, which also is in phase 2 clinical development for the treatment of type 2 diabetes and obstructive sleep apnea. In the area of sexual health, VIVUS is in phase 3 development with avanafil, a PDE5 inhibitor being studied for the treatment of erectile dysfunction.
tdp2664
Newsworthy Stocks
TODAY’S STOCK MARKET DOW JONES INDUSTRIAL AVERAGE DJI, NYSE, S&P 500, NASDAQ INDEX TRENDS, NOTES October 30th, 2010 Week’s Review
dow2664
Anticipation continues that the Federal Reserve will launch a plan to purchase government bonds in an attempt to make loans cheaper and prompt lending, spending and economic growth. Hopes for a swift and intense intervention are getting smaller as reports and economic data portray a recovery that continues to move slowly, but in the right direction. Yesterday, The Commerce Department reported that the economy expanded at a 2% annual rate in the July through September quarter. Consumers were busy helping to increase spending growth values. These posted values revealed a 2.6% growth in spending, up from the 2.2% growth value posted in the second quarter. This represents a continuation of the slow economic recovery trends. Index values finished the last week in October mostly in the green. The Nasdaq, NYSE and Dow Jones Industrials ended the week on a positive note and the Dow Jones Industrials had one of it’s best Octobers in years. The Dow rose 3% in October, the S&P 500 rose 4% and the Nasdaq rose 6% for the month. The dollar strengthened against the euro but lost ground to the British pound and the Japanese yen. The ten year treasury yield ended the week at 2.6% as U.S. Treasury’s closed out the week on the rise. Author: Frank Matto
Nasdaq 100
dow2664
This week's SBV chart example is based on the 15-day SBV(20) Nasdaq 100 (^NDX) chart. +46 points on the Nasdaq 100 Chart 1. Relationship between the SBV Oscillator and index reversal points. Nasdaq 100 index. 15-day view. 1 bar = 15 minutes. SBV(20) In our trading example, we applied the following simple system which is based on our SBV indicator: Once the SBV indicator has fallen below a negative signal level (the indicator will now show red), we will enter a short position (if we are not already short); Once the SBV indicator has advanced above a negative signal level (after having been below that level), we will enter a long position (the indicator still shows red); Once the SBV indicator has rallied above a positive signal level (the indicator will now show green), we will enter a long position (if we are not already long); Once the SBV indicator has fallen below a positive signal level (after having been above that level), we will enter a short position (the indicator still shows green); Additional Stop Loss Rule – If the SBV had dropped into negative territory and has begun to rise without having hit the signal line, close the short position when the SBV is back in positive territory, and stay in cash until a new signal appears. Do the opposite for a long position: if the SBV had moved into positive territory and has begun to decline without having hit the positive signal line, close the long position when the SBV is back in negative territory, and stay in cash until a new signal appears. Detailed system description with explanation of used rules could be found in our ” SBV Trading System ” tutorial. Table 1: Trades based on the 5-rule system. Time Motivation Signal Index Profit (points) 10/12/2010 Rule #2 Buy 2031 +27 10/13/2010 Rule #4 Sell Short 2058 -14 10/15/2010 Rule #2 Buy 2072 +23 10/18/2010 Rule #4 Sell Short 2095 +14 10/19/2010 Rule #2 Buy 2081 -4 10/19/2010 Rule #4 Sell Short 2077 -16 10/20/2010 Rule #2 Buy 2093 -7 10/20/2010 Rule #4 Sell Short 2086 -8 10/22/2010 Rule #2 Buy 2094 +26 10/25/2010 Rule #4 Sell Short 2120 +2 10/25/2010 Rule #5 Cash 2118 10/27/2010 Rule #4 Sell Short 2117 +1 10/27/2010 Rule #2 Buy 2116 0 10/28/2010 Rule #4 Sell Short 2116 -11 10/28/2010 Rule #3 Buy 2127 +5 10/29/2010 Rule #4 Sell Short 2132 +8 Total: +46 (+2.3%) Note: The 20% level for the SBV indicator was determined in relation to the prevailing market conditions at the time that the trading examples were selected. In order to establish the optimal critical levels for the SBV indicator, traders should consider the current market situation and review the history of prior volume surges, including their magnitude (i.e., the level that the SBV indicator reached). Our charts are unique in that they give traders the opportunity to choose the specific chart settings that best fit their personal trading styles and risk tolerances. Traders can thus develop and test their own trading systems. On our charts, you can scroll back in history to test any system that you have created. Disclaimer: The chart example is intended for educational purposes only and does not constitute trading advice or make or imply any market trend prediction.

Monday Morning Outlook: DJIA Settles into Holding Pattern Ahead of Fed, Election
dow2664
Monday Morning Outlook: DJIA Settles into Holding Pattern Ahead of Fed, Election Schaeffers Research – 5 hours ago by Todd Salamone 10/30/2010 11:15 AM The Dow Jones Industrial Average managed another close above the 11,100 level last week, but traders were evidently holding their fire ahead of the midterm …
Monday Morning Outlook: DJIA Settles into Holding Pattern Ahead of Fed, Election
Marijuana Legalization Stocks
dow2664
On Tuesday, November 2, California residents will be voting on Proposition 19, the ballot measure that, if passed, would legalize limited quantities of marijuana for recreational use. This has created plenty of fodder for news reports. The New York Times just reported on the marijuana related domain name land grab. UPI reported that a marijuana dispensary in San Francisco would give away free joints whenever the Giants hit a home run during the World Series. And to top it off, The Wall Street Journal posted an editorial by billionaire investor George Soros, in which he says he supports the legalization of marijuana . Unfortunately, most of the plays on legalization involve very low cap stocks, according to the list of 20 marijuana stocks at WallStreetNewsNetwork.com. However, for the medical use of marijuana and its derivatives, there are larger companies that produce such products as Marinol, a trademark of Solvay SA (SVYSF.PK) and Nabilone, marketed as Cesamet by Valeant Pharmaceuticals International (VRX), which trades on the New York Stock Exchange. Nabilone, a synthetic cannabinoid, is used to treat chemotherapy-induced nausea and vomiting, anorexia, and weight loss in AIDS patients. Valeant also markets Fluorouracil, a cancer treatment drug, and Diastat, a seizure drug. This $4.38 billion market cap stock trades at 30 times earnings, and pays a yield of 1.4%. Earnings for the latest reported quarter were up 41% year over year on a 23% increase in revenues. The company will have its next earnings announcement on November 4. Par Pharmaceutical Companies (PRX), a $1.14 billion market cap company markets Dronabinol, a form of Tetrahydrocannabinol or THC. However, this is a small part of the business as the company markets dozens of other drugs. The stock has a PE ratio of 13.9 and trades at one times sales. Earnings will be reported November 3. GW Pharmaceuticals (GWPRF.PK) produces Sativex, an oral spray with tetrahydrocannabinol and cannabidiol, which is used to treat multiple sclerosis patients, and also for treating pain in cancer patients. Earnings for the quarter ending March 31 were negative. The company will be reporting earnings on November 23. To see the complete free list of twenty marijuana stocks , which shows the symbol, PE ratio, price sales ratio, yield, market capitalization, and business description, go to WallStreetNewsNetwork.com. Disclosure: Author didn’t own any of the above stocks at the time the article was written. By Stockerblog.com
Friday, October 29, 2010
Silver vs. Gold: Industry vs. Investment
A bullish view on Silver Prices via a bearish view on gold…
VICE-PRESIDENT of marketing in North America for Heraeus Precious Metals, the German-based refinery group, Miguel Perez-Santalla doesn’t buy the idea of Gold Investment taking prices much higher from here.
Silver Investment, however, isn’t as crucial as industrial use – now growing strongly, he says.
Here Miguel Perez-Santalla talks to Mike Norman at Hard Assets Investor about what he’s starting to see silver now that prices have shot to 30-year highs…
Hard Assets Investor: Putting gold to one side for a moment, what’s your overall outlook on the other precious metals?
Miguel Perez-Santalla: Well, first off, all the precious metals are following along with Gold Prices, and the weakness of the Dollar, which is another thing holding up the precious metals markets. But there are some very strong fundamentals behind silver.
Silver consumption has gone up greatly. And there’s some tightness in the physical market, though the mines are delivering more. And it takes time for it to hit the marketplace. And that’s because a lot of the electronics industry and the jewelry market are growing tremendously, and because of the price of gold being so high.
HAI: As a substitute…?
Miguel Perez-Santalla: Yes, as a substitute. So there’s a lot of demand for silver. It has a very strong fundamental [outlook]. And I think that even if gold drops percentagewise, silver should hold on to more of its gains.
HAI: Now silver’s trading around $23 an ounce, but was $50 at one time back in 1980.
Miguel Perez-Santalla: But that was market manipulation. The Hunts’ cornering of the silver – or attempted cornering. It didn’t work out so well once the CFTC got involved.
HAI: Wouldn’t you think there would now be pressure or desire to see more controls put on the market? The commercials in the market, who have to deal in this, and the jewelry industry, for them it’s hurting…
Miguel Perez-Santalla: Well, what’s interesting about that is being someone who believes in the free market. At the same time, there have to be rules and boundaries set in place to protect industry, and to protect the individuals. And for instance, when investment money is going in large quantities into these metals, who’s paying for it in the end is the consumer.
For instance, palladium too is also reaching all-time highs. Well, it hasn’t reached all-time highs; it reached $1000 in 2000. But it’s very high right now. And why? Because of the investment money. Otherwise, it wouldn’t be as high because the primary consumption of palladium is the automobile.
HAI: So that speculative element pushes up the price, and that’s passed along to consumers.
Miguel Perez-Santalla: There have to be rules. Just like a football game. You and I – I’m a short little guy and you’re a tall, big guy. If we were playing football together, you’d cream me. It wouldn’t be fair.
HAI: You’d probably run right past me.
Miguel Perez-Santalla: But that’s what happens in the marketplace. Now we have big bullies playing in the market, which are the banks and the funds with their investment capacity. They could just outrun the small guys, and the small guys get crushed if they don’t join the herd.
HAI: Well, that’s the thing. And they have been joining the herd in quantities that continue to grow. So you’re feeling is that they’re going to end up being disappointed.
Miguel Perez-Santalla: Well, at a certain point it’s going to turn. It’s going to turn. Just like the tulip scare in Holland back in the 16th century or whatever it was.
HAI: Right, which devastated the whole Dutch economy.
Miguel Perez-Santalla: Right. When a house sold for one tulip bulb, that was insanity. And that’s the kind of thing we’re seeing now. Because really, what do you do with gold? If the jewelers can’t sell it, and it’s getting too expensive to use…
HAI: You’re saying there’s no intrinsic value to it?
Miguel Perez-Santalla: Well, there is…It’s beautiful. Gold is beautiful. But before King Croesus decided one day that gold was worth 15 head of sheep, no one picked up on gold. But that day when gold became a currency is when it got its value. Unless the government empowered decrees that it has to be money, and exchangeable in the public hemisphere, it’s not money.
HAI: What do you think about the fact that the production of gold – and we just kind of agreed that at least right now it has no intrinsic value – the production of gold uses up real resources…
Miguel Perez-Santalla: Well, there’s a flip side to that. Obviously, it’s producing and consuming all those things, and creating jobs at the same time. There are jobs created around any industry. So I’m not going to knock the entire Gold Mining industry. And there is a demand for gold and jewelry and whatnot. But now the demand has created a bubble, and it’s not being used for its primary, core fundamentals. So that, in a way, is true. Yes, it’s driving away resources from other areas where we should be exploring and investing our monies.
HAI: Very interesting. Thank you, Miguel.
Get the safest gold at the lowest prices using world No.1, BullionVault…
gol2664
Market News: JP Morgan Chase & Co. (NYSE:JPM), Citigroup Inc. (NYSE:C), Toyota Motor Company (NYSE:TM)
More breaking news stories could affect stocks when trading continues later. The following companies should see some movement: JP Morgan Chase & Co. (NYSE:JPM), Citigroup Inc. (NYSE:C), Toyota Motor Company (NYSE:TM). Here is a more detailed look at the news that will affect each company when trading continues. JP Morgan Chase & Co. (NYSE:JPM) J.P. Morgan Chase & Co. (NYSE:JPM) has announced new appointments for Treasury and Security services. On a mission to best serve the demands of valuable clients, J.P. Morgan Chase & Co. (NYSE:JPM) has officially announced new leadership positions in its treasury and security services. The newest appointments include Donald McCree as the CEO of J.P. Morgan Chase & Co. (NYSE:JPM) Treasury Services, Claudia Slacik as the CEO of TSS in Europe, Middle East and Africa, and Tom DuCharme, as previously announced, as the CEO of TSS in the Asia Pacific region. Citigroup Inc. (NYSE:C) Citigroup Inc. (NYSE:C) has bought Israel's 11.69% stake in Discount Bank. The entire 11.69% stake of the Israeli government in Discount Bank has been bought by Citigroup Inc. (NYSE:C) Global Markets Ltd. Discount Bank said yesterday that the deal was worth 832 Million Shekels [$231 Million], and the stake will be distributed to the shares of other institutional investors. The Discount Bank is the third largest bank in Israel in terms of market share. Toyota Motor Company (NYSE:TM) Reports say Toyota Motor Corporation (NYSE:TM) has planned to raise US prices. According to a report appearing in the Yomiuri Shimbun, Toyota Motor Corporation (NYSE:TM) is considering price increases on some of car models bound for the US. The decision is said to be an attempt to counter the impact of stronger yen. In order to prevent negative effects on sales, Toyota Motor Corporation (NYSE:TM) will be increasing the price by only a few percent, said the report. We may see more movement when trading continues for JP Morgan Chase & Co. (NYSE:JPM), Citigroup Inc. (NYSE:C) and Toyota Motor Company (NYSE:TM).
tdp2664
E money daily
Top U.S.-Listed International Stocks with Highest Momentum (Oct 28, 2010)
This ranking was UPDATED TODAY before 4:30 AM ET. Below are the top U.S.-listed international stocks with highest price momentum, which is measured by the ratio of current price divided by 52-week high.
Ranking | Company (Ticker) | Current Price as % of 52-Week High | Country/Region
1 Trinity Biotech plc (ADR) (NASDAQ:TRIB) 100.0% Ireland
2 Hadera Paper Ltd. (AMEX:AIP) 100.0% Israel
3 Check Point Software Technologies Ltd. (NASDAQ:CHKP) 99.9% Israel
4 Arch Capital Group Ltd. (NASDAQ:ACGL) 99.9% Bermuda
5 Teekay Offshore Partners L.P. (NYSE:TOO) 99.8% Bermuda
6 Avago Technologies Limited (NASDAQ:AVGO) 99.8% Singapore
7 Aspen Insurance Holdings Limited (NYSE:AHL) 99.7% Bermuda
8 Advanced Technology Acquisition Corp. (AMEX:AXC) 99.6% Israel
9 Penn West Energy Trust (USA) (NYSE:PWE) 99.6% Canada
10 Baidu.com, Inc. (ADR) (NASDAQ:BIDU) 99.5% China
11 VanceInfo Technologies Inc. (NYSE:VIT) 99.3% China
12 Greenlight Capital Re, Ltd. (NASDAQ:GLRE) 99.3% Cayman Islands
13 Endurance Specialty Holdings Ltd. (NYSE:ENH) 99.3% Bermuda
14 Pengrowth Energy Trust (USA) (NYSE:PGH) 99.2% Canada
15 Cresud Inc. (ADR) (NASDAQ:CRESY) 99.2% Argentina
16 Methanex Corporation (USA) (NASDAQ:MEOH) 99.1% Canada
17 Sociedad Quimica y Minera (ADR) (NYSE:SQM) 99.0% Chile
18 Shamir Optical Industry Ltd. (NASDAQ:SHMR) 99.0% Israel
19 Autoliv Inc. (NYSE:ALV) 99.0% Sweden
20 American Safety Insurance Holdings, Ltd. (NYSE:ASI) 98.9% Bermuda
21 Tata Motors Limited (ADR) (NYSE:TTM) 98.9% India
22 China Yuchai International Limited (NYSE:CYD) 98.9% Singapore
23 Gran Tierra Energy Inc. (AMEX:GTE) 98.9% Canada
24 MDC Partners Inc. (USA) (NASDAQ:MDCA) 98.9% Canada
25 Montpelier Re Holdings Ltd. (NYSE:MRH) 98.8% Bermuda
26 Enbridge Inc. (USA) (NYSE:ENB) 98.7% Canada
27 Cosan Limited (NYSE:CZZ) 98.7% Brazil
28 RenaissanceRe Holdings Ltd. (NYSE:RNR) 98.7% Bermuda
29 Novo Nordisk A/S (ADR) (NYSE:NVO) 98.7% Denmark
30 Allot Communications Ltd. (NASDAQ:ALLT) 98.6% Israel
31 Portugal Telecom, SGPS (ADR) (NYSE:PT) 98.6% Portugal
32 Signet Jewelers Ltd. (NYSE:SIG) 98.6% Bermuda
33 Mettler-Toledo International Inc. (NYSE:MTD) 98.6% Switzerland
34 InterContinental Hotels Group PLC (ADR) (NYSE:IHG) 98.6% United Kingdom
35 Validus Holdings, Ltd. (NYSE:VR) 98.6% Bermuda
36 ACE Limited (NYSE:ACE) 98.5% Switzerland
37 Axis Capital Holdings Limited (NYSE:AXS) 98.4% Bermuda
38 PartnerRe Ltd. (NYSE:PRE) 98.4% Bermuda
39 Dr. Reddy's Laboratories Limited (ADR) (NYSE:RDY) 98.4% India
40 SunOpta, Inc. (USA) (NASDAQ:STKL) 98.3% Canada
41 Agrium Inc. (USA) (NYSE:AGU) 98.1% Canada
42 Charm Communications Inc (NASDAQ:CHRM) 98.1% China
43 Hutchison Telecom Intl. Limited (ADR) (NYSE:HTX) 98.1% Hong Kong
44 Platinum Underwriters Holdings, Ltd. (NYSE:PTP) 98.1% Bermuda
45 Compania de Minas Buenaventura SA (ADR) (NYSE:BVN) 98.0% Peru
46 Fresenius Medical Care AG & Co. (ADR) (NYSE:FMS) 98.0% Germany
47 UTi Worldwide Inc. (NASDAQ:UTIW) 98.0% Virgin Islands, British
48 Magna International Inc. (USA) (NYSE:MGA) 98.0% Canada
49 Allied World Assurance Holdings, Ltd. (NYSE:AWH) 97.9% Bermuda
50 Petrobras Energia Participaciones SA ADR (NYSE:PZE) 97.9% Argentina
51 Vodafone Group Plc (ADR) (NASDAQ:VOD) 97.9% United Kingdom
52 Ecopetrol S.A. (ADR) (NYSE:EC) 97.8% Colombia
53 Alcon, Inc. (NYSE:ACL) 97.8% Switzerland
54 Chunghwa Telecom Co., Ltd (ADR) (NYSE:CHT) 97.8% Taiwan
55 Enerplus Resources Fund (USA) (NYSE:ERF) 97.7% Canada
56 Embotelladora Andina SA (ADR) (NYSE:AKO.A) 97.7% Chile
57 Nippon Telegraph & Telephone Corp. (ADR) (NYSE:NTT) 97.7% Japan
58 ORIX Corporation (ADR) (NYSE:IX) 97.7% Japan
59 Royal Dutch Shell plc (ADR) (NYSE:RDS.A) 97.7% Netherlands
60 Accenture Plc (NYSE:ACN) 97.6% Ireland
61 Enstar Group Ltd. (NASDAQ:ESGR) 97.6% Bermuda
62 Brookfield Infrastructure Partners L.P. (NYSE:BIP) 97.6% Bermuda
63 Teekay Corporation (NYSE:TK) 97.6% Bermuda
64 Credicorp Ltd. (USA) (NYSE:BAP) 97.5% Peru
65 Grupo Televisa, S.A. (ADR) (NYSE:TV) 97.5% Mexico
66 Wacoal Holdings Corporation (ADR) (NASDAQ:WACLY) 97.5% Japan
67 Fundtech Ltd. (NASDAQ:FNDT) 97.5% Israel
68 Crucell N.V. (ADR) (NASDAQ:CRXL) 97.5% Netherlands
69 Pan American Silver Corp. (USA) (NASDAQ:PAAS) 97.4% Canada
70 Ryanair Holdings plc (ADR) (NASDAQ:RYAAY) 97.3% Ireland
71 LJ International, Inc. (NASDAQ:JADE) 97.3% Hong Kong
72 BCE Inc. (USA) (NYSE:BCE) 97.3% Canada
73 British American Tobacco (ADR) (AMEX:BTI) 97.3% United Kingdom
74 Voltaire Ltd. (NASDAQ:VOLT) 97.2% Israel
75 HONDA MOTOR CO., LTD. (ADR) (NYSE:HMC) 97.2% Japan
76 America Movil SAB de CV (ADR) (NYSE:AMX) 97.1% Mexico
77 WPP PLC (ADR) (NASDAQ:WPPGY) 97.0% Ireland
78 MDS Inc. (USA) (NYSE:MDZ) 97.0% Canada
79 Luxottica Group S.p.A. (ADR) (NYSE:LUX) 96.9% Italy
80 Diageo plc (ADR) (NYSE:DEO) 96.8% United Kingdom
81 Ingersoll-Rand PLC (NYSE:IR) 96.8% Ireland
82 Rio Tinto plc (ADR) (NYSE:RIO) 96.8% United Kingdom
83 Brasil Telecom Participacoes SA (ADR) (NYSE:BRP) 96.8% Brazil
84 NovaGold Resources Inc. (USA) (AMEX:NG) 96.8% Canada
85 RiT Technologies Ltd. (NASDAQ:RITT) 96.7% Israel
86 IRSA Inversiones Representaciones (ADR) (NYSE:IRS) 96.7% Argentina
87 BHP Billiton Limited (ADR) (NYSE:BHP) 96.7% Australia
88 Baytex Energy Trust (USA) (NYSE:BTE) 96.6% Canada
89 XL Group plc (NYSE:XL) 96.6% Ireland
90 Spreadtrum Communications, Inc. (NASDAQ:SPRD) 96.5% China
91 BHP Billiton plc (ADR) (NYSE:BBL) 96.5% United Kingdom
92 FirstService Corporation (USA) (NASDAQ:FSRV) 96.5% Canada
93 MI Developments Inc. (USA) (NYSE:MIM) 96.4% Canada
94 Brookfield Asset Management Inc. (USA) (NYSE:BAM) 96.4% Canada
95 Argo Group International Holdings, Ltd. (NASDAQ:AGII) 96.4% Bermuda
96 China Petroleum & Chemical Corp. (ADR) (NYSE:SNP) 96.3% China
97 YM BioSciences Inc. (USA) (AMEX:YMI) 96.3% Canada
98 Hitachi, Ltd. (ADR) (NYSE:HIT) 96.3% Japan
99 Mountain Province Diamonds, Inc. (AMEX:MDM) 96.3% Canada
100 Knightsbridge Tankers Limited (NASDAQ:VLCCF) 96.3% Bermuda
101 Lan Airlines S.A. (ADR) (NYSE:LFL) 96.3% Chile
102 Shire Plc. (ADR) (NASDAQ:SHPGY) 96.2% United Kingdom
103 NetEase.com, Inc. (ADR) (NASDAQ:NTES) 96.2% China
104 Philippine Long Distance Telephone (ADR) (NYSE:PHI) 96.2% Philippines
105 The Bank of Nova Scotia (USA) (NYSE:BNS) 96.1% Canada
106 Tim Hortons Inc. (USA) (NYSE:THI) 96.1% Canada
107 Potash Corp./Saskatchewan (USA) (NYSE:POT) 96.1% Canada
108 CTC Media, Inc. (NASDAQ:CTCM) 96.1% Russia
109 Kyocera Corporation (ADR) (NYSE:KYO) 96.1% Japan
110 SK Telecom Co., Ltd. (ADR) (NYSE:SKM) 96.0% South Korea
111 EZchip Semiconductor Ltd. (NASDAQ:EZCH) 96.0% Israel
112 Valeant Pharmaceuticals Int (USA) (NYSE:VRX) 96.0% Canada
113 Logitech International SA (USA) (NASDAQ:LOGI) 95.9% Switzerland
114 Syngenta AG (ADR) (NYSE:SYT) 95.9% Switzerland
115 Novartis AG (ADR) (NYSE:NVS) 95.9% Switzerland
116 AutoNavi Holdings Ltd (NASDAQ:AMAP) 95.9% China
117 Primus Guaranty, Ltd. (NYSE:PRS) 95.8% Bermuda
118 AudioCodes Ltd. (NASDAQ:AUDC) 95.8% Israel
119 Cogo Group, Inc. (NASDAQ:COGO) 95.7% China
120 Fronteer Gold Inc. (AMEX:FRG) 95.7% Canada
121 Domtar Corp. (USA) (NYSE:UFS) 95.7% Canada
122 Teekay LNG Partners L.P. (NYSE:TGP) 95.6% Bermuda
123 Reed Elsevier NV (ADR) (NYSE:ENL) 95.6% Netherlands
124 Canadian Pacific Railway Limited (USA) (NYSE:CP) 95.6% Canada
125 Ctrip.com International, Ltd. (ADR) (NASDAQ:CTRP) 95.5% China
126 Acergy S.A. (ADR) (NASDAQ:ACGY) 95.5% Luxembourg
127 Fly Leasing Ltd(ADR) (NYSE:FLY) 95.5% Ireland
128 Central Gold-Trust (AMEX:GTU) 95.4% Canada
129 Fomento Economico Mexicano SAB (ADR) (NYSE:FMX) 95.4% Mexico
130 Sappi Limited (ADR) (NYSE:SPP) 95.4% South Africa
131 Herbalife Ltd. (NYSE:HLF) 95.4% Cayman Islands
132 ABB Ltd (ADR) (NYSE:ABB) 95.3% Switzerland
133 7 DAYS GROUP HOLDINGS LIMITED(ADR) (NYSE:SVN) 95.3% China
134 BT Group plc (ADR) (NYSE:BT) 95.3% United Kingdom
135 Golar LNG Limited (USA) (NASDAQ:GLNG) 95.3% Bermuda
136 Reed Elsevier plc (ADR) (NYSE:RUK) 95.3% United Kingdom
137 Canadian Imperial Bank of Commerce (USA) (NYSE:CM) 95.2% Canada
138 Siemens AG (ADR) (NYSE:SI) 95.2% Germany
139 Focus Media Holding Limited (ADR) (NASDAQ:FMCN) 95.1% Hong Kong
140 AstraZeneca plc (ADR) (NYSE:AZN) 95.1% United Kingdom
141 Melco Crown Entertainment Ltd (NASDAQ:MPEL) 95.1% Hong Kong
142 China Telecom Corporation Limited (ADR) (NYSE:CHA) 95.1% China
143 SINA Corporation (USA) (NASDAQ:SINA) 95.0% China
144 TransCanada Corporation (USA) (NYSE:TRP) 95.0% Canada
145 Nice Systems Ltd. (ADR) (NASDAQ:NICE) 95.0% Israel
146 Canon Inc. (ADR) (NYSE:CAJ) 95.0% Japan
147 Pampa Energia S.A. (ADR) (NYSE:PAM) 95.0% Argentina
148 Agnico-Eagle Mines Limited (USA) (NYSE:AEM) 95.0% Canada
149 Bancolombia S.A. (ADR) (NYSE:CIB) 94.9% Colombia
150 Chicago Bridge & Iron Company N.V. (NYSE:CBI) 94.9% Netherlands
151 Empresas ICA SA (ADR) (NYSE:ICA) 94.9% Mexico
152 Sensata Technologies Holding N.V. (NYSE:ST) 94.9% Netherlands
153 Silver Wheaton Corp. (USA) (NYSE:SLW) 94.9% Canada
154 A.F.P Provida SA (ADR) (NYSE:PVD) 94.8% Chile
155 Enersis S.A. (ADR) (NYSE:ENI) 94.8% Chile
156 Embraer – Empr Bras Aeronautica (ADR) (NYSE:ERJ) 94.8% Brazil
157 Repsol YPF, S.A. (ADR) (NYSE:REP) 94.8% Spain
158 Empresa Nacional de Electricidad (ADR) (NYSE:EOC) 94.7% Chile
159 Central Fund of Canada Limited (USA) (AMEX:CEF) 94.7% Canada
160 Grupo Aeroportuario del Pacifico (ADR) (NYSE:PAC) 94.6% Mexico
161 Corpbanca (ADR) (NYSE:BCA) 94.6% Chile
162 Anheuser-Busch InBev NV (ADR) (NYSE:BUD) 94.6% Belgium
163 Carnival plc (ADR) (NYSE:CUK) 94.5% United Kingdom
164 Compania Cervecerias Unidas S.A. (ADR) (NYSE:CCU) 94.5% Chile
165 Canadian National Railway (USA) (NYSE:CNI) 94.5% Canada
166 Innospec Inc. (NASDAQ:IOSP) 94.4% United Kingdom
167 HiSoft Technology International Limited (NASDAQ:HSFT) 94.4% China
168 Sohu.com Inc. (NASDAQ:SOHU) 94.4% China
169 Silvercorp Metals Inc. (USA) (NYSE:SVM) 94.3% Canada
170 Banco Santander (Brasil) SA(ADR) (NYSE:BSBR) 94.3% Brazil
171 Banco Latinoamericano de Comercio Exr SA (NYSE:BLX) 94.2% Panama
172 CPFL Energia S.A. (ADR) (NYSE:CPL) 94.2% Brazil
173 Harmony Gold Mining Co. (ADR) (NYSE:HMY) 94.2% South Africa
174 3SBio Inc. (ADR) (NASDAQ:SSRX) 94.1% China
175 RADVISION LTD. (USA) (NASDAQ:RVSN) 94.1% Israel
176 Augusta Resource Corp. (USA) (AMEX:AZC) 94.1% Canada
177 Silicom Ltd. (NASDAQ:SILC) 94.1% Israel
178 IESI BFC Ltd (NYSE:BIN) 94.0% Canada
179 Tyco Electronics Ltd. (NYSE:TEL) 94.0% Switzerland
180 Vina Concha y Toro S.A. (ADR) (NYSE:VCO) 94.0% Chile
181 TELUS Corporation (USA) (NYSE:TU) 94.0% Canada
182 NTT DoCoMo, Inc. (ADR) (NYSE:DCM) 94.0% Japan
183 Teck Resources Limited (NYSE:TCK) 93.9% Canada
184 SAP AG (ADR) (NYSE:SAP) 93.8% Germany
185 Home Inns & Hotels Management Inc. (ADR) (NASDAQ:HMIN) 93.8% China
186 Denison Mines Corp. (AMEX:DNN) 93.8% Canada
187 Coca-Cola FEMSA, S.A.B. de C.V. (ADR) (NYSE:KOF) 93.7% Mexico
188 Ultrapar Participacoes SA (ADR) (NYSE:UGP) 93.7% Brazil
189 China Techfaith Wireless Comm. Tech. Ltd (NASDAQ:CNTF) 93.7% China
190 China Mobile Ltd. (ADR) (NYSE:CHL) 93.7% Hong Kong
191 AngloGold Ashanti Limited (ADR) (NYSE:AU) 93.7% South Africa
192 Schlumberger Limited. (NYSE:SLB) 93.6% Netherland Antilles
193 CNOOC Limited (ADR) (NYSE:CEO) 93.6% Hong Kong
194 Mag Silver Corp (ADR) (AMEX:MVG) 93.6% Canada
195 51job, Inc. (ADR) (NASDAQ:JOBS) 93.6% China
196 Provident Energy Trust (USA) (NYSE:PVX) 93.5% Canada
197 TransGlobe Energy Corporation (USA) (NASDAQ:TGA) 93.5% Canada
198 Endeavour Silver Corp. (CAN) (AMEX:EXK) 93.5% Canada
199 Alumina Limited (ADR) (NYSE:AWC) 93.5% Australia
200 Tyco International Ltd. (NYSE:TYC) 93.5% Switzerland
201 Fresh Del Monte Produce Inc. (NYSE:FDP) 93.5% Cayman Islands
202 Sasol Limited (ADR) (NYSE:SSL) 93.4% South Africa
203 Alto Palermo S.A. (ADR) (NASDAQ:APSA) 93.4% Argentina
204 Changyou.com Limited(ADR) (NASDAQ:CYOU) 93.4% China
205 TIM Participacoes SA (ADR) (NYSE:TSU) 93.3% Brazil
206 Banco Bradesco SA (ADR) (NYSE:BBD) 93.3% Brazil
207 ICICI Bank Limited (ADR) (NYSE:IBN) 93.3% India
208 China Metro Rural Holdings Ltd (AMEX:CNR) 93.2% Hong Kong
209 New Gold Inc. (USA) (AMEX:NGD) 93.2% Canada
210 Everest Re Group, Ltd. (NYSE:RE) 93.2% Bermuda
211 Maiden Holdings, Ltd. (NASDAQ:MHLD) 93.2% Bermuda
212 Navios Maritime Partners L.P. (NYSE:NMM) 93.2% Greece
213 Companhia Energetica Minas Gerais (ADR) (NYSE:CIG) 93.1% Brazil
214 Companhia de Bebidas das Americas (ADR) (NYSE:ABV) 93.1% Brazil
215 PT Telekomunikasi Indonesia (ADR) (NYSE:TLK) 93.1% Indonesia
216 Nortel Inversora S.A. (ADR) (NYSE:NTL) 93.1% Argentina
217 Yanzhou Coal Mining Co. (ADR) (NYSE:YZC) 93.1% China
218 Gol Linhas Aereas Inteligentes SA (ADR) (NYSE:GOL) 93.1% Brazil
219 China Eastern Airlines Corp. Ltd. (ADR) (NYSE:CEA) 93.1% China
220 Amdocs Limited (NYSE:DOX) 93.0% United Kingdom
221 China Kanghui Holdings (NYSE:KH) 93.0% China
222 Silver Standard Resources Inc. (USA) (NASDAQ:SSRI) 93.0% Canada
223 Banco Itau Holding Financeira S.A. (ADR) (NYSE:ITUB) 92.9% Brazil
224 Braskem SA (ADR) (NYSE:BAK) 92.9% Brazil
225 Ship Finance International Limited (NYSE:SFL) 92.9% Bermuda
226 Seaspan Corporation (NYSE:SSW) 92.9% Hong Kong
227 Banco Macro SA (ADR) (NYSE:BMA) 92.8% Argentina
228 Companhia Brasileira de Distrib. (ADR) (NYSE:CBD) 92.8% Brazil
229 Banco Santander-Chile (ADR) (NYSE:SAN) 92.7% Chile
230 Sinopec Shanghai Petrochemical Co. (ADR) (NYSE:SHI) 92.7% China
231 Companhia Paranaense de Energia (ADR) (NYSE:ELP) 92.7% Brazil
232 Pearson PLC (ADR) (NYSE:PSO) 92.7% United Kingdom
233 Grupo Aeroportuario del Centro Nort(ADR) (NASDAQ:OMAB) 92.6% Mexico
234 BBVA Banco Frances S.A. (ADR) (NYSE:BFR) 92.6% Argentina
235 Shaw Communications Inc. (USA) (NYSE:SJR) 92.5% Canada
236 ASML Holding N.V. (ADR) (NASDAQ:ASML) 92.5% Netherlands
237 Stantec Inc. (USA) (NYSE:STN) 92.5% Canada
238 Banco de Chile (ADR) (NYSE:BCH) 92.5% Chile
239 Gold Fields Limited (ADR) (NYSE:GFI) 92.4% South Africa
240 Cenovus Energy Inc (ADR) (NYSE:CVE) 92.4% Canada
241 UBS AG (USA) (NYSE:UBS) 92.4% Switzerland
242 Toronto-Dominion Bank (USA) (NYSE:TD) 92.3% Canada
243 Companhia de Saneamento Basico (ADR) (NYSE:SBS) 92.3% Brazil
244 TAM S.A. (ADR) (NYSE:TAM) 92.3% Brazil
245 Vale (ADR) (NYSE:VALE) 92.3% Brazil
246 Infosys Technologies Limited (ADR) (NASDAQ:INFY) 92.2% India
247 Lululemon Athletica inc. (NASDAQ:LULU) 92.2% Canada
248 PetroChina Company Limited (ADR) (NYSE:PTR) 92.2% China
249 Millicom International Cellular SA (USA) (NASDAQ:MICC) 92.1% Luxembourg
250 China Lodging Group, Ltd (NASDAQ:HTHT) 92.1% China
251 Crude Carriers Corp. (NYSE:CRU) 91.8% Greece
252 Barrick Gold Corporation (USA) (NYSE:ABX) 91.8% Canada
253 CGI Group Inc. (USA) (NYSE:GIB) 91.8% Canada
254 CE Franklin Ltd. (USA) (NASDAQ:CFK) 91.7% Canada
255 Willis Group Holdings PLC (NYSE:WSH) 91.7% United Kingdom
256 CAE, Inc. (USA) (NYSE:CAE) 91.6% Canada
257 Ultrapetrol (Bahamas) Limited (NASDAQ:ULTR) 91.5% Bahamas
258 China Unicom (Hong Kong) Limited (ADR) (NYSE:CHU) 91.5% Hong Kong
259 PT Indosat Tbk (ADR) (NYSE:IIT) 91.4% Indonesia
260 Cellcom Israel Ltd. (NYSE:CEL) 91.4% Israel
261 Coca-Cola HBC S.A. (ADR) (NYSE:CCH) 91.4% Greece
262 Hollysys Automation Technologies Ltd (NASDAQ:HOLI) 91.3% China
263 Taiwan Semiconductor Mfg. Co. Ltd. (ADR) (NYSE:TSM) 91.1% Taiwan
264 Kobex Minerals Inc. (USA) (AMEX:KXM) 91.1% Canada
265 CNinsure Inc. (NASDAQ:CISG) 91.1% China
266 JinkoSolar Holding Co., Ltd. (NYSE:JKS) 90.9% China
267 Oncolytics Biotech, Inc. (USA) (NASDAQ:ONCY) 90.9% Canada
268 Pluristem Therapeutics Inc. (NASDAQ:PSTI) 90.9% Israel
269 Bank of Montreal (USA) (NYSE:BMO) 90.8% Canada
270 Gafisa SA (ADR) (NYSE:GFA) 90.8% Brazil
271 China Southern Airlines Limited (ADR) (NYSE:ZNH) 90.7% China
272 Simcere Pharmaceutical Group (NYSE:SCR) 90.7% China
273 NXP Semiconductors NV (NASDAQ:NXPI) 90.7% Netherlands
274 GlaxoSmithKline plc (ADR) (NYSE:GSK) 90.5% United Kingdom
275 Sprott Physical Gold Trust (NYSE:PHYS) 90.4% Canada
276 Claude Resources Inc. (USA) (AMEX:CGR) 90.4% Canada
277 Cameco Corporation (USA) (NYSE:CCJ) 90.4% Canada
278 Mobile TeleSystems OJSC (ADR) (NYSE:MBT) 90.3% Russia
279 Commtouch Software Ltd. (NASDAQ:CTCH) 90.2% Israel
280 ZHONGPIN INC. (NASDAQ:HOGS) 90.2% China
281 Keyuan Petrochemicals, Inc. (NASDAQ:KYNP) 90.2% China
282 International Tower Hill Mines Ltd(USA] (AMEX:THM) 90.1% Canada
283 Telecom Argentina S.A. (ADR) (NYSE:TEO) 90.1% Argentina
284 Telefonica de Argentina SA (ADR) (NYSE:TAR) 90.0% Argentina
285 Descartes Systems Group (USA) (NASDAQ:DSGX) 89.9% Canada
286 Telecomunicacoes de Sao Paulo SA (ADR) (NYSE:TSP) 89.9% Brazil
287 China Finance Online Co. (ADR) (NASDAQ:JRJC) 89.9% China
288 Longtop Financial Technologies Limited (NYSE:LFT) 89.8% China
289 Wimm-Bill-Dann Foods OJSC (ADR) (NYSE:WBD) 89.8% Russia
290 Net Servicos de Comunicacao SA (ADR) (NASDAQ:NETC) 89.7% Brazil
291 Radware Ltd. (NASDAQ:RDWR) 89.6% Israel
292 Banro Corporation (AMEX:BAA) 89.5% Canada
293 SMTC Corporation (USA) (NASDAQ:SMTX) 89.5% Canada
294 ENSCO PLC (NYSE:ESV) 89.5% United Kingdom
295 Tanzanian Royalty Exploration Corp. (US) (AMEX:TRE) 89.5% Canada
296 BRF Brasil Foods SA(ADR) (NYSE:BRFS) 89.4% Brazil
297 G. Willi-Food International Limited (NASDAQ:WILC) 89.3% Israel
298 Optibase Ltd. (NASDAQ:OBAS) 89.3% Israel
299 Prudential Public Limited Company (ADR) (NYSE:PUK) 89.3% United Kingdom
300 Tianli Agritech, Inc. (NASDAQ:OINK) 89.2% China
301 Open Text Corporation (USA) (NASDAQ:OTEX) 89.2% Canada
302 Advanced Semiconductor Engineering (ADR) (NYSE:ASX) 89.2% Taiwan
303 New Oriental Education & Tech. Group Inc (NYSE:EDU) 89.2% China
304 Fuwei Films (Holdings) Co., Ltd (NASDAQ:FFHL) 89.1% China
305 Tongjitang Chinese Medicines Co. (ADR) (NYSE:TCM) 89.1% China
306 Talisman Energy Inc. (USA) (NYSE:TLM) 89.0% Canada
307 KT Corporation (ADR) (NYSE:KT) 89.0% South Korea
308 Ivanhoe Mines Ltd. (USA) (NYSE:IVN) 88.9% Canada
309 Aurizon Mines Ltd.(USA) (AMEX:AZK) 88.9% Canada
310 Quest Capital Corp. (USA) (AMEX:SILU) 88.9% Canada
311 CNH Global N.V. (ADR) (NYSE:CNH) 88.8% Netherlands
312 Chinacast Education Corporation (NASDAQ:CAST) 88.8% China
313 Goldcorp Inc. (USA) (NYSE:GG) 88.8% Canada
314 Kandi Technolgies Corp. (NASDAQ:KNDI) 88.7% China
315 Telefonica S.A. (ADR) (NYSE:TEF) 88.7% Spain
316 Unilever N.V. (ADR) (NYSE:UN) 88.7% Netherlands
317 Telefonaktiebolaget LM Ericsson (ADR) (NASDAQ:ERIC) 88.6% Sweden
318 Mitsui & Co., Ltd. (ADR) (NASDAQ:MITSY) 88.6% Japan
319 AerCap Holdings N.V. (NYSE:AER) 88.6% Netherlands
320 Nevsun Resources (USA) (AMEX:NSU) 88.5% Canada
321 IMAX Corporation (USA) (NASDAQ:IMAX) 88.5% Canada
322 TransAlta Corporation (USA) (NYSE:TAC) 88.5% Canada
323 Helen of Troy Limited (NASDAQ:HELE) 88.4% Bermuda
324 Ituran Location and Control Ltd. (US) (NASDAQ:ITRN) 88.3% Israel
325 MakeMyTrip Limited (NASDAQ:MMYT) 88.3% India
326 Camelot Information Systems Inc (NYSE:CIS) 88.3% China
327 Rogers Communications Inc. (USA) (NYSE:RCI) 88.3% Canada
328 Genpact Limited (NYSE:G) 88.1% Bermuda
329 Safe Bulkers, Inc. (NYSE:SB) 88.1% Greece
330 Unilever plc (ADR) (NYSE:UL) 88.0% United Kingdom
331 Turkcell Iletisim Hizmetleri A.S. (ADR) (NYSE:TKC) 88.0% Turkey
332 Canadian Natural Resource Ltd (USA) (NYSE:CNQ) 87.9% Canada
333 Lazard Ltd (NYSE:LAZ) 87.9% Bermuda
334 Great Basin Gold Ltd. (USA) (AMEX:GBG) 87.8% Canada
335 HDFC Bank Limited (ADR) (NYSE:HDB) 87.7% India
336 Global Sources Ltd. (Bermuda) (NASDAQ:GSOL) 87.6% Bermuda
337 Longwei Petroleum Investment Hold Ltd (AMEX:LPH) 87.5% China
338 Sierra Wireless, Inc. (USA) (NASDAQ:SWIR) 87.5% Canada
339 Aracruz Celulose SA (ADR) (NYSE:ARA) 87.5% Brazil
340 Energy XXI (Bermuda) Limited (NASDAQ:EXXI) 87.4% Bermuda
341 Gentium S.p.A. (ADR) (NASDAQ:GENT) 87.4% Italy
342 Flagstone Reinsurance Holdings SA (NYSE:FSR) 87.4% Bermuda
343 Nova Measuring Instruments Ltd. (NASDAQ:NVMI) 87.4% Israel
344 ASM International N.V. (USA) (NASDAQ:ASMI) 87.4% Netherlands
345 Gildan Activewear Inc. (USA) (NYSE:GIL) 87.4% Canada
346 ARM Holdings plc (ADR) (NASDAQ:ARMH) 87.3% United Kingdom
347 Transportadora de Gas del Sur SA (ADR) (NYSE:TGS) 87.2% Argentina
348 Keegan Resources Inc. (AMEX:KGN) 87.1% Canada
349 eLong, Inc. (ADR) (NASDAQ:LONG) 87.1% China
350 Imperial Oil Limited (USA) (AMEX:IMO) 87.0% Canada
351 Shinhan Financial Group Co., Ltd. (ADR) (NYSE:SHG) 86.9% South Korea
352 Guangshen Railway Co. Ltd (ADR) (NYSE:GSH) 86.7% China
353 MercadoLibre, Inc. (NASDAQ:MELI) 86.6% Argentina
354 Nidec Corporation (ADR) (NYSE:NJ) 86.6% Japan
355 Telecom Italia S.p.A. (ADR) (NYSE:TI) 86.6% Italy
356 Wipro Limited (ADR) (NYSE:WIT) 86.6% India
357 Trina Solar Limited (ADR) (NYSE:TSL) 86.5% China
358 Teekay Tankers Ltd. (NYSE:TNK) 86.5% Bermuda
359 Core Laboratories N.V. (NYSE:CLB) 86.4% Netherlands
360 Makita Corporation (ADR) (NASDAQ:MKTAY) 86.4% Japan
361 Formula Systems (1985) Ltd. (ADR) (NASDAQ:FORTY) 86.3% Israel
362 Grupo Financiero Galicia S.A. (ADR) (NASDAQ:GGAL) 86.2% Argentina
363 Syneron Medical Ltd. (NASDAQ:ELOS) 86.2% Israel
364 Panasonic Corporation (ADR) (NYSE:PC) 86.2% Japan
365 YPF SA (ADR) (NYSE:YPF) 86.1% Argentina
366 Gilat Satellite Networks Ltd. (NASDAQ:GILT) 86.1% Israel
367 Lihua International, Inc. (NYSE:LIWA) 86.1% China
368 Almaden Minerals Ltd. (USA) (AMEX:AAU) 86.0% Canada
369 MIND C.T.I. Ltd. (NASDAQ:MNDO) 86.0% Israel
370 Kubota Corporation (ADR) (NYSE:KUB) 86.0% Japan
371 Randgold Resources Ltd. (ADR) (NASDAQ:GOLD) 86.0% Jersey
372 France Telecom SA (ADR) (NYSE:FTE) 85.9% France
373 Royal Bank of Canada (USA) (NYSE:RY) 85.9% Canada
374 Cott Corporation (USA) (NYSE:COT) 85.7% Canada
375 Danaos Corporation (NYSE:DAC) 85.7% Greece
376 DHT Holdings Inc (NYSE:DHT) 85.7% Jersey
377 Capital Product Partners L.P. (NASDAQ:CPLP) 85.6% Greece
378 Mercer International Inc. (NASDAQ:MERC) 85.6% Canada
379 Taseko Mines Limited (USA) (AMEX:TGB) 85.5% Canada
380 LDK Solar Co., Ltd. (NYSE:LDK) 85.4% China
381 Koninklijke Philips Electronics NV (ADR) (NYSE:PHG) 85.4% Netherlands
382 Northern Dynasty Minerals Ltd. (USA) (AMEX:NAK) 85.4% Canada
383 Magic Software Enterprises Ltd. (NASDAQ:MGIC) 85.3% Israel
384 Vivo Participacoes SA (ADR) (NYSE:VIV) 85.2% Brazil
385 Grupo Aeroportuario del Sureste (ADR) (NYSE:ASR) 85.1% Mexico
386 Nam Tai Electronics, Inc. (NYSE:NTE) 85.0% China
387 Tenaris S.A. (ADR) (NYSE:TS) 84.9% Luxembourg
388 Harry Winston Diamond Corporation (USA) (NYSE:HWD) 84.9% Canada
389 Trintech Group PLC (ADR) (NASDAQ:TTPA) 84.8% Ireland
390 EDENOR S.A. (ADR) (NYSE:EDN) 84.8% Argentina
391 Alexco Resource Corp. (USA) (AMEX:AXU) 84.8% Canada
392 EXFO Electro-Optical Engineering (USA) (NASDAQ:EXFO) 84.7% Canada
393 Westpac Banking Corporation (ADR) (NYSE:WBK) 84.2% Australia
394 Homex Development Corp. (ADR) (NYSE:HXM) 84.2% Mexico
395 China Digital TV Holding Co., Ltd. (NYSE:STV) 84.2% China
396 Ku6 Media Co., Ltd. (ADR) (NASDAQ:KUTV) 84.1% China
397 Sun Life Financial Inc. (USA) (NYSE:SLF) 84.1% Canada
398 Aixtron AG (ADR) (NASDAQ:AIXG) 84.1% Germany
399 RADCOM Ltd. (NASDAQ:RDCM) 84.1% Israel
400 North American Palladium Ltd. (AMEX:PAL) 83.9% Canada
401 B Communications Ltd (NASDAQ:SMLC) 83.9% Israel
402 Sony Corporation (ADR) (NYSE:SNE) 83.7% Japan
403 Smith & Nephew plc (ADR) (NYSE:SNN) 83.7% United Kingdom
404 JA Solar Holdings Co., Ltd. (ADR) (NASDAQ:JASO) 83.6% China
405 IAMGOLD Corporation (USA) (NYSE:IAG) 83.5% Canada
406 KONAMI CORPORATION (ADR) (NYSE:KNM) 83.4% Japan
407 ChinaEdu Corporation (ADR) (NASDAQ:CEDU) 83.3% China
408 China Information Security Tech, Inc. (NASDAQ:CNIT) 83.3% China
409 WuXi PharmaTech (Cayman) Inc. (ADR) (NYSE:WX) 83.3% China
410 China Life Insurance Company Ltd. (ADR) (NYSE:LFC) 83.3% China
411 Garmin Ltd. (NASDAQ:GRMN) 83.1% Switzerland
412 Giant Interactive Group Inc (NYSE:GA) 83.0% China
413 Textainer Group Holdings Limited (NYSE:TGH) 83.0% Bermuda
414 Pointer Telocation Limited (NASDAQ:PNTR) 83.0% Israel
415 Industrias Bachoco, S.A.B. de C.V. (ADR) (NYSE:IBA) 83.0% Mexico
416 Partner Communications Company Ltd (ADR) (NASDAQ:PTNR) 82.8% Israel
417 Suncor Energy Inc. (USA) (NYSE:SU) 82.8% Canada
418 ClickSoftware Technologies Ltd. (NASDAQ:CKSW) 82.8% Israel
419 Gruma S.A.B. de C.V. (ADR) (NYSE:GMK) 82.7% Mexico
420 Sanofi-Aventis SA (ADR) (NYSE:SNY) 82.7% France
421 InterOil Corporation (USA) (NYSE:IOC) 82.6% Australia
422 Alterra Capital Holdings Ltd. (NASDAQ:ALTE) 82.4% Bermuda
423 Weatherford International Ltd. (NYSE:WFT) 82.2% Switzerland
424 Eldorado Gold Corporation (USA) (NYSE:EGO) 82.2% Canada
425 Fabrinet (NYSE:FN) 82.1% Thailand
426 LG Display Co Ltd. (ADR) (NYSE:LPL) 82.0% South Korea
427 Solarfun Power Holdings Co., Ltd. (ADR) (NASDAQ:SOLF) 82.0% China
428 China Intelligent Lighting & Elec Inc (AMEX:CIL) 81.9% China
429 Alcatel-Lucent (ADR) (NYSE:ALU) 81.9% France
430 Richmont Mines Inc. (USA) (AMEX:RIC) 81.9% Canada
431 Global Indemnity plc (NASDAQ:GBLI) 81.9% Cayman Islands
432 Marvell Technology Group Ltd. (NASDAQ:MRVL) 81.8% Bermuda
433 Bonso Electronics International Inc. (NASDAQ:BNSO) 81.8% Hong Kong
434 Huaneng Power International, Inc. (ADR) (NYSE:HNP) 81.6% China
435 SMART Technologies Inc (NASDAQ:SMT) 81.5% Canada
436 ShengdaTech, Inc. (NASDAQ:SDTH) 81.5% China
437 National Grid plc (ADR) (NYSE:NGG) 81.4% United Kingdom
438 QLT Inc. (USA) (NASDAQ:QLTI) 81.4% Canada
439 Star Bulk Carriers Corp. (NASDAQ:SBLK) 81.3% Greece
440 Mahanagar Telephone Nigam Limited (ADR) (NYSE:MTE) 81.2% India
441 KB Financial Group, Inc. (ADR) (NYSE:KB) 81.1% South Korea
442 Crosshair Exploration & Mining Corp. (AMEX:CXZ) 81.1% Canada
443 Harbin Electric, Inc. (NASDAQ:HRBN) 81.1% China
444 Euroseas Ltd. (NASDAQ:ESEA) 81.1% Greece
445 HSBC Holdings plc (ADR) (NYSE:HBC) 80.7% United Kingdom
446 ReneSola Ltd. (ADR) (NYSE:SOL) 80.7% China
447 Entertainment Gaming Asia Inc. (AMEX:EGT) 80.6% Hong Kong
448 Sonde Resources Corp. (AMEX:SNG) 80.5% Canada
449 Eni S.p.A. (ADR) (NYSE:E) 80.5% Italy
450 Delhaize Group (ADR) (NYSE:DEG) 80.5% Belgium
451 Statoil ASA(ADR) (NYSE:STO) 80.4% Norway
452 Kingtone Wirelessinfo Solutions Hldg Ltd (NASDAQ:KONE) 80.2% China
453 Paramount Gold and Silver Corp. (AMEX:PZG) 80.2% Canada
454 Actions Semiconductor Co., Ltd. (ADR) (NASDAQ:ACTS) 80.2% China
455 Ternium S.A. (ADR) (NYSE:TX) 80.1% Luxembourg
456 Orient-Express Hotels Ltd. (NYSE:OEH) 80.1% Bermuda
457 Teva Pharmaceutical Industries Ltd (ADR) (NASDAQ:TEVA) 80.0% Israel
458 China HGS Real Estate, Inc. (NASDAQ:HGSH) 80.0% China
459 Silicon Motion Technology Corp. (ADR) (NASDAQ:SIMO) 80.0% Taiwan
460 China Sunergy Co., Ltd. (ADR) (NASDAQ:CSUN) 80.0% China
461 Yongye International, Inc. (NASDAQ:YONG) 79.9% China
462 Ceragon Networks Ltd. (NASDAQ:CRNT) 79.8% Israel
463 Telecom Corp of New Zealand (ADR) (NYSE:NZT) 79.8% New Zealand
464 B + H Ocean Carriers Ltd. (AMEX:BHO) 79.8% Bermuda
465 Eurand N.V. (NASDAQ:EURX) 79.8% Netherlands
466 Ritchie Bros. Auctioneers (USA) (NYSE:RBA) 79.5% Canada
467 Mitsubishi UFJ Financial Group Inc (ADR) (NYSE:MTU) 79.4% Japan
468 Retalix Limited (NASDAQ:RTLX) 79.3% Israel
469 TOTAL S.A. (ADR) (NYSE:TOT) 79.3% France
470 Warner Chilcott Plc (NASDAQ:WCRX) 79.3% Ireland
471 O2Micro International Limited (ADR) (NASDAQ:OIIM) 79.2% Cayman Islands
472 Navios Maritime Holdings Inc. (NYSE:NM) 79.2% Greece
473 Royal Bank of Scotland Group plc (ADR) (NYSE:RBS) 79.2% United Kingdom
474 STMicroelectronics N.V. (ADR) (NYSE:STM) 79.0% Switzerland
475 Internet Gold Golden Lines Ltd. (NASDAQ:IGLD) 78.9% Israel
476 Telefonos de Mexico, S.A. (ADR) (NYSE:TMX) 78.9% Mexico
477 Compugen Ltd. (USA) (NASDAQ:CGEN) 78.8% Israel
478 Highway Holdings Limited (NASDAQ:HIHO) 78.8% Hong Kong
479 Grupo Simec S.A.B. de C.V. (ADR) (AMEX:SIM) 78.7% Mexico
480 Samson Oil & Gas Limited (ADR) (AMEX:SSN) 78.7% Australia
481 Triple-S Management Corp. (NYSE:GTS) 78.7% Puerto Rico
482 Elbit Systems Ltd. (ADR) (NASDAQ:ESLT) 78.4% Israel
483 China Natural Resources Inc. (NASDAQ:CHNR) 78.4% Hong Kong
484 VimpelCom Ltd. (NYSE:VIP) 78.3% Netherlands
485 RADA Electronic Ind. Ltd. (NASDAQ:RADA) 78.3% Israel
486 Nexen Inc. (USA) (NYSE:NXY) 78.0% Canada
487 Companhia Siderurgica Nacional (ADR) (NYSE:SID) 78.0% Brazil
488 Protalix BioTherapeutics Inc. (AMEX:PLX) 78.0% Israel
489 Northgate Minerals Corporation (USA) (AMEX:NXG) 78.0% Canada
490 Woori Finance Holdings Co., Ltd. (ADR) (NYSE:WF) 78.0% South Korea
491 Celestica Inc. (USA) (NYSE:CLS) 78.0% Canada
492 Xyratex Ltd. (NASDAQ:XRTX) 77.9% United Kingdom
493 Global Education and Technology Group (NASDAQ:GEDU) 77.9% China
494 Altisource Portfolio Solutions S.A. (NASDAQ:ASPS) 77.8% Luxembourg
495 Steiner Leisure Limited (NASDAQ:STNR) 77.8% Bahamas
496 Qiagen NV (NASDAQ:QGEN) 77.8% Netherlands
497 Veolia Environnement (ADR) (NYSE:VE) 77.6% France
498 Global Crossing Ltd. (NASDAQ:GLBC) 77.6% Bermuda
499 Sterlite Industries India Limited (ADR) (NYSE:SLT) 77.5% India
500 Nymox Pharmaceutical Corporation (NASDAQ:NYMX) 77.3% Canada
501 Mellanox Technologies, Ltd. (NASDAQ:MLNX) 77.3% Israel
502 EnCana Corporation (USA) (NYSE:ECA) 77.3% Canada
503 Sapiens International Corporation N.V. (NASDAQ:SPNS) 77.2% Netherland Antilles
504 Toyota Motor Corporation (ADR) (NYSE:TM) 77.1% Japan
505 Copa Holdings, S.A. (NYSE:CPA) 76.8% Panama
506 Deutsche Bank AG (USA) (NYSE:DB) 76.7% Germany
507 Covidien plc (NYSE:COV) 76.7% Ireland
508 AEGON N.V. (ADR) (NYSE:AEG) 76.6% Netherlands
509 Flextronics International Ltd. (NASDAQ:FLEX) 76.4% Singapore
510 Kinross Gold Corporation (USA) (NYSE:KGC) 76.3% Canada
511 VocalTec Communications Ltd. (NASDAQ:CALL) 76.1% Israel
512 Nabors Industries Ltd. (NYSE:NBR) 75.9% Bermuda
513 Top Image Systems Ltd. (NASDAQ:TISA) 75.8% Israel
514 E-House (China) Holdings Limited (NYSE:EJ) 75.8% China
515 Fushi Copperweld, Inc. (NASDAQ:FSIN) 75.7% China
516 Oriental Financial Group Inc. (NYSE:OFG) 75.6% Puerto Rico
517 Funtalk China Holdings Ltd. (NASDAQ:FTLK) 75.6% China
518 Gravity Co., LTD. (ADR) (NASDAQ:GRVY) 75.6% South Korea
519 Nordic American Tanker Shipping Limited (NYSE:NAT) 75.5% Bermuda
520 Orthofix International NV (NASDAQ:OFIX) 75.5% Netherland Antilles
521 Noble Corporation (NYSE:NE) 75.5% Cayman Islands
522 Minco Gold Corporation (ADR) (AMEX:MGH) 75.3% Canada
523 North American Energy Partners Inc.(USA) (NYSE:NOA) 75.3% Canada
524 Advantage Oil & Gas Ltd. (NYSE:AAV) 75.2% Canada
525 Renhuang Pharmaceuticals, Inc. (AMEX:RHGP) 75.0% China
526 Cardero Resources Corp. (USA) (AMEX:CDY) 74.7% Canada
527 AirMedia Group Inc. (ADR) (NASDAQ:AMCN) 74.6% China
528 Tata Communications Limited (ADR) (NYSE:TCL) 74.5% India
529 POSCO (ADR) (NYSE:PKX) 74.4% South Korea
530 Barclays PLC (ADR) (NYSE:BCS) 74.3% United Kingdom
531 Puda Coal, Inc (AMEX:PUDA) 74.2% China
532 China Gerui Adv Mtals Grp Ltd (NASDAQ:CHOP) 74.2% China
533 China Medical Technologies, Inc. (ADR) (NASDAQ:CMED) 74.1% China
534 AU Optronics Corp. (ADR) (NYSE:AUO) 74.1% Taiwan
535 Advantest Corp. (ADR) (NYSE:ATE) 74.0% Japan
536 QKL Stores Inc (NASDAQ:QKLS) 74.0% China
537 Entree Gold Inc. (AMEX:EGI) 73.9% Canada
538 Minefinders Corp. Ltd. (USA) (AMEX:MFN) 73.9% Canada
539 Yamana Gold Inc. (USA) (NYSE:AUY) 73.8% Canada
540 Patni Computer Systems Limited (ADR) (NYSE:PTI) 73.7% India
541 Diana Shipping Inc. (NYSE:DSX) 73.7% Greece
542 THT Heat Transfer Technology, Inc.(NDA) (NASDAQ:THTI) 73.6% China
543 Shiner International, Inc. (NASDAQ:BEST) 73.6% China
544 Korea Electric Power Corporation (ADR) (NYSE:KEP) 73.5% South Korea
545 On Track Innovations Ltd.(USA) (NASDAQ:OTIV) 73.4% Israel
546 Given Imaging Ltd. (NASDAQ:GIVN) 73.3% Israel
547 Sorl Auto Parts, Inc. (NASDAQ:SORL) 73.3% China
548 Recon Technology, Ltd. (NASDAQ:RCON) 73.3% China
549 Vitran Corporation, Inc. (USA) (NASDAQ:VTNC) 73.0% Canada
550 City Telecom (H.K.) Limited (ADR) (NASDAQ:CTEL) 72.9% Hong Kong
551 Chemspec International Ltd (NYSE:CPC) 72.9% China
552 Himax Technologies, Inc. (ADR) (NASDAQ:HIMX) 72.9% Taiwan
553 Vimicro International Corporation (ADR) (NASDAQ:VIMC) 72.9% China
554 Mechel OAO (ADR) (NYSE:MTL) 72.8% Russia
555 Tower Semiconductor Ltd. (USA) (NASDAQ:TSEM) 72.7% Israel
556 Research In Motion Limited (USA) (NASDAQ:RIMM) 72.5% Canada
557 American Lorain Corporation (AMEX:ALN) 72.2% China
558 Orbotech Ltd. (NASDAQ:ORBK) 72.2% Israel
559 Qiao Xing Mobile Communication Co., Ltd. (NYSE:QXM) 72.1% China
560 China Biologic Products Inc (NASDAQ:CBPO) 71.9% China
561 Cemex SAB de CV (ADR) (NYSE:CX) 71.9% Mexico
562 RRSat Global Communications Network Ltd. (NASDAQ:RRST) 71.8% Israel
563 Grupo TMM, S.A.B. (ADR) (NYSE:TMM) 71.8% Mexico
564 Mindray Medical International Limited (NYSE:MR) 71.7% China
565 Fibria Celulose S.A. (ADR) (NYSE:FBR) 71.6% Brazil
566 Terra Nova Royalty Corp (NYSE:TTT) 71.5% Canada
567 Frontline Ltd. (USA) (NYSE:FRO) 71.5% Bermuda
568 Sino Clean Energy Inc. (NASDAQ:SCLX) 71.2% China
569 Credit Suisse Group AG (ADR) (NYSE:CS) 71.0% Switzerland
570 Excel Maritime Carriers Ltd (NYSE:EXM) 71.0% Greece
571 Tucows Inc. (USA) (AMEX:TCX) 70.8% Canada
572 Banco Santander, S.A. (ADR) (NYSE:STD) 70.8% Spain
573 Camtek LTD. (NASDAQ:CAMT) 70.7% Israel
574 Seagate Technology PLC (NASDAQ:STX) 70.5% Ireland
575 Exeter Resource Corp. (AMEX:XRA) 70.5% Canada
576 CGG Veritas (ADR) (NYSE:CGV) 70.4% France
577 ING Groep N.V. (ADR) (NYSE:ING) 70.4% Netherlands
578 Wonder Auto Technology, Inc. (NASDAQ:WATG) 70.3% China
579 New Energy Systems Group. (AMEX:NEWN) 70.3% China
580 BluePhoenix Solutions, Ltd.(USA) (NASDAQ:BPHX) 70.2% Israel
581 United Microelectronics Corp (ADR) (NYSE:UMC) 70.0% Taiwan
582 Lloyds TSB Group plc (ADR) (NYSE:LYG) 70.0% United Kingdom
583 China Pharma Holdings, Inc. (AMEX:CPHI) 69.9% China
584 China Integrated Energy, Inc. (NASDAQ:CBEH) 69.7% China
585 Global-Tech Advanced Innovations Inc. (NASDAQ:GAI) 69.6% Hong Kong
586 Assured Guaranty Ltd. (NYSE:AGO) 69.3% Bermuda
587 Rubicon Minerals Corp. (USA) (AMEX:RBY) 69.3% Canada
588 Concord Medical Services Holding Ltd. (NYSE:CCM) 69.2% China
589 Gerdau SA (ADR) (NYSE:GGB) 69.1% Brazil
590 Thompson Creek Metals Company, Inc. (NYSE:TC) 69.1% Canada
591 eFuture Information Technology Inc. (NASDAQ:EFUT) 68.8% China
592 T.A.T. Technologies Ltd. (NASDAQ:TATT) 68.7% Israel
593 Aluminum Corp. of China Limited (ADR) (NYSE:ACH) 68.6% China
594 Anooraq Resources Corporation (USA) (AMEX:ANO) 68.5% Canada
595 Paragon Shipping Inc. (NYSE:PRGN) 68.5% Greece
596 Verigy Ltd. (NASDAQ:VRGY) 68.3% Singapore
597 Flamel Technologies S.A. (ADR) (NASDAQ:FLML) 68.3% France
598 Transocean LTD (NYSE:RIG) 68.0% Switzerland
599 Nokia Corporation (ADR) (NYSE:NOK) 67.9% Finland
600 China Education Alliance, Inc. (NYSE:CEU) 67.8% China
601 Sify Technologies Limited (NASDAQ:SIFY) 67.7% India
602 Rediff.com India Limited (ADR) (NASDAQ:REDF) 67.7% India
603 Grupo Radio Centro SAB de CV (ADR) (NYSE:RC) 67.6% Mexico
604 Seabridge Gold, Inc. (USA) (AMEX:SA) 67.5% Canada
605 China Shen Zhou Mining & Resources Inc. (AMEX:SHZ) 67.4% China
606 Magal Security Systems Ltd. (USA) (NASDAQ:MAGS) 67.3% Israel
607 Ninetowns Internet Technlgy Grp Co Ltd. (NASDAQ:NINE) 67.1% China
608 Navios Maritime Acquisition Corporation (NYSE:NNA.U) 67.0% Greece
609 Shanda Interactive Entertainment Ltd ADR (NASDAQ:SNDA) 66.8% China
610 Foster Wheeler Ltd. (NASDAQ:FWLT) 66.7% Switzerland
611 Grupo Casa Saba, S.A. (ADR) (NYSE:SAB) 66.6% Mexico
612 Tele Norte Leste Participacoes SA (ADR) (NYSE:TNE) 66.5% Brazil
613 Acorn International, Inc. (ADR) (NYSE:ATV) 66.4% China
614 Mizuho Financial Group, Inc. (ADR) (NYSE:MFG) 66.4% Japan
615 Pacific Rim Mining Corp. (USA) (AMEX:PFRMF) 66.2% Canada
616 AsiaInfo-Linkage, Inc. (NASDAQ:ASIA) 66.0% China
617 Ness Technologies, Inc. (NASDAQ:NSTC) 65.9% Israel
618 Yuhe International, Inc (NASDAQ:YUII) 65.9% China
619 StealthGas Inc. (NASDAQ:GASS) 65.9% Greece
620 ArcelorMittal (ADR) (NYSE:MT) 65.8% Luxembourg
621 Popular, Inc. (NASDAQ:BPOP) 65.8% Puerto Rico
622 Siliconware Precision Industries (ADR) (NASDAQ:SPIL) 65.8% Taiwan
623 Banco Bilbao Vizcaya Argentaria SA (ADR) (NYSE:BBVA) 65.7% Spain
624 Platinum Group Metals Limited (USA) (AMEX:PLG) 65.4% Canada
625 CDC Software Corp (NASDAQ:CDCS) 65.1% Hong Kong
626 Elan Corporation, plc (ADR) (NYSE:ELN) 65.0% Ireland
627 China Ritar Power Corp. (NASDAQ:CRTP) 65.0% China
628 China Distance Education Holdings Ltd. (NYSE:DL) 65.0% China
629 NIVS IntelliMedia Technology Group Inc (NYSE:NIV) 64.8% China
630 IFM Investments Limited (NYSE:CTC) 64.6% China
631 Winner Medical Group, Inc (NASDAQ:WWIN) 64.4% China
632 BP plc (ADR) (NYSE:BP) 64.3% United Kingdom
633 WNS (Holdings) Limited (ADR) (NYSE:WNS) 64.3% India
634 ICON plc (ADR) (NASDAQ:ICLR) 64.2% Ireland
635 ZST Digital Networks Inc (NASDAQ:ZSTN) 64.2% China
636 ChipMOS Technologies (Bermuda) Ltd (NASDAQ:IMOS) 64.0% Taiwan
637 Tianyin Pharmaceutical Co, Inc. (AMEX:TPI) 63.8% China
638 James Hardie Industries SE (NYSE:JHX) 63.6% Netherlands
639 Magyar Telekom Plc. (ADR) (NYSE:MTA) 63.5% Hungary
640 Central European Media Enterprises Ltd. (NASDAQ:CETV) 63.5% Bermuda
641 Ampal-American Israel Corporation (NASDAQ:AMPL) 63.2% Israel
642 Yingli Green Energy Hold. Co. Ltd. (ADR) (NYSE:YGE) 63.2% China
643 China-Biotics Inc. (NASDAQ:CHBT) 63.0% China
644 Petroleo Brasileiro SA (ADR) (NYSE:PBR) 63.0% Brazil
645 China Real Estate Information Corp (NASDAQ:CRIC) 62.8% China
646 Internet Initiative Japan Inc. (ADR) (NASDAQ:IIJI) 62.7% Japan
647 New Oriental Energy & Chemical Corp. (NASDAQ:NOEC) 62.6% China
648 Eltek Ltd. (NASDAQ:ELTK) 62.6% Israel
649 Pansoft Company Limited (NASDAQ:PSOF) 62.6% China
650 China Yida Holding, Co. (NASDAQ:CNYD) 62.4% Hong Kong
651 China Mass Media Intl Adv Corp. (ADR) (NYSE:CMM) 62.3% China
652 VistaPrint NV (NASDAQ:VPRT) 62.3% Bermuda
653 ATA Inc.(ADR) (NASDAQ:ATAI) 62.1% China
654 Brasil Telecom SA (ADR) (NYSE:BTM) 62.0% Brazil
655 Telvent Git, S.A (NASDAQ:TLVT) 61.8% Spain
656 Qiao Xing Universal Resources, Inc. (NASDAQ:XING) 61.7% China
657 Flexible Solutions International, Inc. (AMEX:FSI) 61.6% Canada
658 Nomura Holdings, Inc. (ADR) (NYSE:NMR) 61.5% Japan
659 Guanwei Recycling Corp. (NASDAQ:GPRC) 61.4% China
660 IncrediMail Ltd. (USA) (NASDAQ:MAIL) 61.4% Israel
661 Envoy Capital Group Inc. (NASDAQ:ECGI) 61.3% Canada
662 Leading Brands, Inc. (NASDAQ:LBIX) 60.7% Canada
663 DRDGOLD Ltd. (ADR) (NASDAQ:DROOY) 60.6% South Africa
664 The9 Limited (ADR) (NASDAQ:NCTY) 60.6% China
665 Semiconductor Manufacturing Int'l (ADR) (NYSE:SMI) 60.5% China
666 Consolidated Water Co. Ltd. (NASDAQ:CWCO) 60.5% Cayman Islands
667 IntelliPharmaCeutics Intl Inc (USA) (NASDAQ:IPCI) 60.4% Canada
668 Manulife Financial Corporation (USA) (NYSE:MFC) 60.3% Canada
669 Alon Holdings Blue Square Israel Ltd (NYSE:BSI) 60.1% Israel
670 Linktone Ltd. (ADR) (NASDAQ:LTON) 60.1% China
671 Deswell Industries, Inc. (NASDAQ:DSWL) 60.0% Macao
672 Skystar Bio-Pharmaceutical Company (NASDAQ:SKBI) 60.0% China
673 China Precision Steel, Inc. (NASDAQ:CPSL) 59.9% Hong Kong
674 ChinaNet Online Holdings Inc (NDA) (NASDAQ:CNET) 59.9% China
675 De Beira Goldfields Inc(NDA) (NASDAQ:D1Q) 59.7% Australia
676 Jingwei International Limited (NASDAQ:JNGW) 59.7% China
677 Alpha and Omega Semiconductor Ltd (NASDAQ:AOSL) 59.7% Bermuda
678 Alvarion Ltd. (USA) (NASDAQ:ALVR) 59.6% Israel
679 China TransInfo Technology Corp. (NASDAQ:CTFO) 59.4% China
680 Deer Consumer Products, Inc. (NASDAQ:DEER) 59.3% China
681 China Valves Technology, Inc. (NASDAQ:CVVT) 59.3% China
682 Tsakos Energy Navigation Ltd. (NYSE:TNP) 59.2% Greece
683 Origin Agritech Ltd. (NASDAQ:SEED) 59.1% China
684 Shanda Games Limited(ADR) (NASDAQ:GAME) 59.1% China
685 China Nepstar Chain Drugstore Ltd. (NYSE:NPD) 58.7% China
686 China Advanced Con. Materials Gr. Inc (NASDAQ:CADC) 58.6% China
687 Dejour Enterprises Ltd (USA) (AMEX:DEJ) 58.5% Canada
688 China Security & Surveillance Tech. Inc. (NYSE:CSR) 58.4% China
689 Perfect World Co., Ltd. (ADR) (NASDAQ:PWRD) 58.4% China
690 CRH PLC (ADR) (NYSE:CRH) 58.3% Ireland
691 OccuLogix, Inc. (USA) (NASDAQ:TEAR) 58.2% Canada
692 China Automotive Systems, Inc. (NASDAQ:CAAS) 58.2% China
693 Net 1 UEPS Technologies, Inc. (NASDAQ:UEPS) 58.1% South Africa
694 CARDIOME PHARMA CORP (NASDAQ:CRME) 58.0% Canada
695 BOS Better OnLine Sol (USA) (NASDAQ:BOSC) 58.0% Israel
696 DragonWave, Inc.(USA) (NASDAQ:DRWI) 57.9% Canada
697 Midway Gold Corp. (AMEX:MDW) 57.7% Canada
698 DryShips Inc. (NASDAQ:DRYS) 57.7% Greece
699 Gushan Environmental Energy Limited (NYSE:GU) 57.5% China
700 LML Payment Systems, Inc. (NASDAQ:LMLP) 57.4% Canada
701 Ivanhoe Energy Inc. (USA) (NASDAQ:IVAN) 57.3% Canada
702 Copernic Inc. (NASDAQ:CNIC) 56.7% Canada
703 MER Telemanagement Solutions Ltd. (NASDAQ:MTSL) 56.6% Israel
704 Andatee China Marine Fuel Ser Corp (NASDAQ:AMCF) 56.5% China
705 Gulf Resources, Inc. (NASDAQ:GFRE) 56.4% China
706 AEterna Zentaris Inc. (USA) (NASDAQ:AEZS) 56.2% Canada
707 Xinyuan Real Estate Co., Ltd. (ADR) (NYSE:XIN) 55.9% China
708 Natuzzi, S.p.A (ADR) (NYSE:NTZ) 55.5% Italy
709 Elbit Imaging Ltd (NASDAQ:EMITF) 55.4% Israel
710 Ballard Power Systems Inc. (USA) (NASDAQ:BLDP) 55.3% Canada
711 Orckit Communications Ltd (NASDAQ:ORCT) 55.3% Israel
712 Shengkai Innovations, Inc. (NASDAQ:VALV) 55.1% China
713 RINO International Corporation (NASDAQ:RINO) 54.6% China
714 American Oriental Bioengineering, Inc. (NYSE:AOB) 54.5% China
715 Maxcom Telecomunic S.A.B. de C.V. (ADR) (NYSE:MXT) 54.4% Mexico
716 Torm A/S (ADR) (NASDAQ:TRMD) 53.7% Denmark
717 EDAP TMS S.A. (ADR) (NASDAQ:EDAP) 53.6% France
718 FreeSeas Inc. (NASDAQ:FREE) 53.1% Greece
719 Gammon Gold, Inc. (NYSE:GRS) 53.1% Canada
720 China Architectural Engineering, Inc. (NASDAQ:CAEI) 52.9% China
721 Satyam Computer Services Limited(ADR) (NYSE:SAYCY) 52.8% India
722 China Wind Systems, Inc. (NASDAQ:CWS) 52.6% China
723 Wuhan General Group China Inc. (NASDAQ:WUHN) 52.2% China
724 China Shenghuo Pharmaceutical Hldg, Inc. (AMEX:KUN) 52.1% China
725 CIBT Education Group Inc. (USA) (AMEX:MBA) 52.0% Canada
726 Jinpan International Limited (NASDAQ:JST) 52.0% China
727 China Recycling Energy Corp. (NASDAQ:CREG) 51.9% China
728 Genetic Technologies Limited (ADR) (NASDAQ:GENE) 51.9% Australia
729 Telestone Technologies Corporation (NASDAQ:TSTC) 51.9% China
730 Biostar Pharmaceuticals, Inc. (NASDAQ:BSPM) 51.9% China
731 Equal Energy Ltd. (USA) (NYSE:EQU) 51.6% Canada
732 TOP Ships Inc. (NASDAQ:TOPS) 51.5% Greece
733 Sutor Technology Group Ltd. (NASDAQ:SUTR) 51.3% China
734 AgFeed Industries, Inc. (NASDAQ:FEED) 51.1% China
735 MGT Capital Investments Inc. (AMEX:MGT) 51.0% United Kingdom
736 AutoChina International Limited (NASDAQ:AUTC) 50.9% China
737 Mitel Networks Corporation (NASDAQ:MITL) 50.8% Canada
738 China Electric Motor, Inc. (NASDAQ:CELM) 50.6% China
739 Kimber Resources, Inc. (AMEX:KBX) 50.6% Canada
740 China BAK Battery Inc. (NASDAQ:CBAK) 50.2% China
741 China Fire & Security Group, Inc. (NASDAQ:CFSG) 49.7% China
742 Jacada Ltd. (NASDAQ:JCDA) 49.5% Israel
743 Tri-Tech Holding, Inc. (NASDAQ:TRIT) 49.5% China
744 CDC Corporation (NASDAQ:CHINA) 49.3% Hong Kong
745 China Auto Logistics Inc (NASDAQ:CALI) 49.3% China
746 General Steel Holdings, Inc. (NYSE:GSI) 49.1% China
747 China Nuokang Bio-Pharmaceutical Inc. (NASDAQ:NKBP) 49.1% China
748 China Hydroelectric Corporation (NYSE:CHC) 49.0% China
749 Jiangbo Pharmaceuticals, Inc. (NASDAQ:JGBO) 48.3% China
750 China GengSheng Minerals, Inc. (AMEX:CHGS) 47.8% China
751 Cimatron Ltd. (NASDAQ:CIMT) 47.5% Israel
752 KongZhong Corporation (ADR) (NASDAQ:KONG) 47.3% China
753 Suntech Power Holdings Co., Ltd. (ADR) (NYSE:STP) 47.2% China
754 TBS International plc (NASDAQ:TBSI) 47.2% Ireland
755 Aegean Marine Petroleum Network Inc. (NYSE:ANW) 47.1% Greece
756 China Housing & Land Development, Inc. (NASDAQ:CHLN) 46.8% China
757 China Natural Gas, Inc. (NASDAQ:CHNG) 45.6% China
758 China Jo Jo Drugstores Inc (NASDAQ:CJJD) 45.5% China
759 Private Media Group Inc. (NASDAQ:PRVT) 44.9% Spain
760 NF Energy Saving Corp (NASDAQ:NFEC) 44.9% China
761 BMB Munai Inc. (AMEX:KAZ) 44.3% Kazakhstan
762 Canadian Solar Inc. (NASDAQ:CSIQ) 44.3% China
763 Crystallex International Corp. (USA) (AMEX:KRY) 44.3% Canada
764 PolyMet Mining Corp. (USA) (AMEX:PLM) 44.1% Canada
765 China Cord Blood Corp (NYSE:CO) 44.0% China
766 SinoHub Inc (AMEX:SIHI) 43.5% China
767 China Green Agriculture, Inc (NYSE:CGA) 41.4% China
768 Compton Petroleum Corporation (USA) (NYSE:CMZPF) 41.4% Canada
769 Agria Corporation (ADR) (NYSE:GRO) 41.1% China
770 Hong Kong Highpower Technology, Inc. (NASDAQ:HPJ) 40.4% China
771 Prana Biotechnology Limited (ADR) (NASDAQ:PRAN) 40.0% Australia
772 China Agritech Inc. (NASDAQ:CAGC) 39.9% China
773 China Technology Development Group Corp. (NASDAQ:CTDC) 39.8% Hong Kong
774 Sinovac Biotech Ltd. (NASDAQ:SVA) 39.7% China
775 Dehaier Medical Systems Ltd (NASDAQ:DHRM) 39.6% China
776 Zoom Technologies, Inc. (NASDAQ:ZOOM) 39.5% China
777 Subaye Inc (NASDAQ:SBAY) 38.8% China
778 Universal Travel Group (NYSE:UTA) 38.8% China
779 VisionChina Media Inc (NASDAQ:VISN) 38.6% China
780 Kingsway Financial Services Inc. (USA) (NYSE:KFS) 38.5% Canada
781 China GrenTech Corporation Limited (ADR) (NASDAQ:GRRF) 38.5% China
782 GigaMedia Limited (NASDAQ:GIGM) 37.9% Taiwan
783 Rosetta Genomics Ltd. (USA) (NASDAQ:ROSG) 37.6% Israel
784 Labopharm Inc. (NASDAQ:DDSS) 37.5% Canada
785 Orient Paper Inc (AMEX:ONP) 36.8% China
786 Wowjoint Holdings Ltd (NASDAQ:BWOWU) 36.7% Hong Kong
787 Angiotech Pharmaceuticals, Inc. (USA) (NASDAQ:ANPI) 36.6% Canada
788 Transition Therapeutics Inc. (NASDAQ:TTHI) 36.1% Canada
789 Technicolor S.A.(ADR) (NYSE:TCH) 35.7% France
790 SmartHeat Inc (NASDAQ:HEAT) 35.5% China
791 A-Power Energy Generation Systems, Ltd. (NASDAQ:APWR) 35.3% China
792 Noah Education Holdings Ltd. (ADR) (NYSE:NED) 33.9% China
793 China Sky One Medical, Inc. (NASDAQ:CSKI) 33.3% China
794 Majestic Capital, Ltd. (NASDAQ:MAJC) 32.8% Bermuda
795 Euro Tech Holdings Co. Ltd. (NASDAQ:CLWT) 32.5% Hong Kong
796 WSP Holdings Limited (NYSE:WH) 30.7% China
797 Omega Navigation Enterprises, Inc. (NASDAQ:ONAV) 30.4% Greece
798 Oilsands Quest Inc. (AMEX:BQI) 30.3% Canada
799 Fuqi International, Inc. (NASDAQ:FUQI) 29.9% China
800 SearchMedia Holdings Limited (AMEX:IDI) 29.4% China
801 GEROVA Financial Group, Ltd. (NYSE:GFC) 29.2% Cayman Islands
802 National Bank of Greece (ADR) (NYSE:NBG) 29.1% Greece
803 Seanergy Maritime Holdings Corp. (NASDAQ:SHIP) 28.5% Greece
804 Duoyuan Global Water Inc (NYSE:DGW) 28.3% China
805 NewLead Holdings Ltd (NASDAQ:NEWL) 28.2% Greece
806 CryptoLogic Limited (USA) (NASDAQ:CRYP) 27.7% Canada
807 American Dairy, Inc. (NYSE:ADY) 27.7% China
808 New Dragon Asia Corp. (AMEX:NWD) 26.2% China
809 Tiens Biotech Group (USA), Inc. (AMEX:TBV) 25.8% China
810 GeoGlobal Resources Inc. (AMEX:GGR) 25.7% Canada
811 OceanFreight Inc. (NASDAQ:OCNF) 25.6% Greece
812 Hydrogenics Corporation (USA) (NASDAQ:HYGS) 25.0% Canada
813 Bank of Ireland (ADR) (NYSE:IRE) 24.6% Ireland
814 Metalink Ltd. (NASDAQ:MTLK) 24.5% Israel
815 Alpha Pro Tech, Ltd. (AMEX:APT) 23.5% Canada
816 Duoyuan Printing, Inc. (NYSE:DYP) 23.2% China
817 Doral Financial Corp. (NYSE:DRL) 21.4% Puerto Rico
818 Globalink Limited (NASDAQ:GOBK) 21.1% Canada
819 Birks & Mayors Inc. (AMEX:BMJ) 20.3% Canada
820 Orsus Xelent Technologies Inc. (AMEX:ORS) 18.9% China
821 Xinhua Finance Media Limited (ADR) (NASDAQ:XSEL) 18.2% China
822 Novogen Limited (ADR) (NASDAQ:NVGN) 17.0% Australia
823 Allied Irish Banks, plc. (ADR) (NYSE:AIB) 16.4% Ireland
824 SinoCoking Coal and Coke Chem Ind, Inc. (NASDAQ:SCOK) 14.7% China
825 China Infrastructure Investment Corp (NASDAQ:CIIC) 12.4% China
826 Marshall Edwards, Inc. (NASDAQ:MSHL) 12.0% Australia
827 China INSOnline Corp. (NASDAQ:CHIO) 10.9% China
828 Fresenius Kabi Pharma. Holding Inc (NASDAQ:APCVZ) 9.9% Germany
829 First BanCorp. (NYSE:FBP) 7.6% Puerto Rico
tdp2664
China Analyst
Top U.S.-Listed International Stocks with Highest Momentum (Oct 28, 2010)